In Part 3, I showed that a magnitude responses calculated from impulse responses produced by the MLS and swept sine methods produce different results when the measurement signals themselves are distorted.
In this posting, I’ll focus on the swept sine method which showed that the apparent magnitude response of the system looked like a strange version of a low shelving filter, but there’s a really easy explanation for this that goes back to something I wrote in Part 1.
The way these systems work is to cross-correlate the signal that comes back from the DUT with the signal that was sent to it. Cross-correlation (in this case) is a bit of math that tells you how similar two signals are when they’re compared over a change in time (sort of…). So, if the incoming signal is identical to the outgoing signal at one moment in time but no other, then the result (the impulse response) looks like a spike that hits 1 (meaning “identical”) at one moment, and is 0 (meaning “not at all alike in any way…”) at all other times.
However, one important thing to remember is that both an MLS signal and a swept sine wave take some time to play. So, on the one hand, it’s a little weird to think of a 10-second sweep or MLS signal being converted to a theoretically-infinitely short impulse. On the other hand, this can be done if the system doesn’t change in time and therefore never changes: something we call a Linear Time-Invariant (or LTI) system.
But what happens if the DUT’s behaviour DOES change over time? Then things get weird.
At the end of Part 1, I said
For both the MLS and the sine sweep, I’m applying a pre-emphasis filter to the signal sent to the DUT and a reciprocal de-emphasis filter to the signal coming from it. This puts a bass-heavy tilt on the signal to be more like the spectrum of music. However, it’s not a “pinking” filter, which would cause a loss of SNR due to the frequency-domain slope starting at too low a frequency.
Then, in Part 2 I said that, to distort the signals, I
look for the peak value of the measurement signal coming into the DUT, and then clip it.
It’s the combination of these two things that results in the magnitude response of the system measured using a swept sine wave looking the way it does.
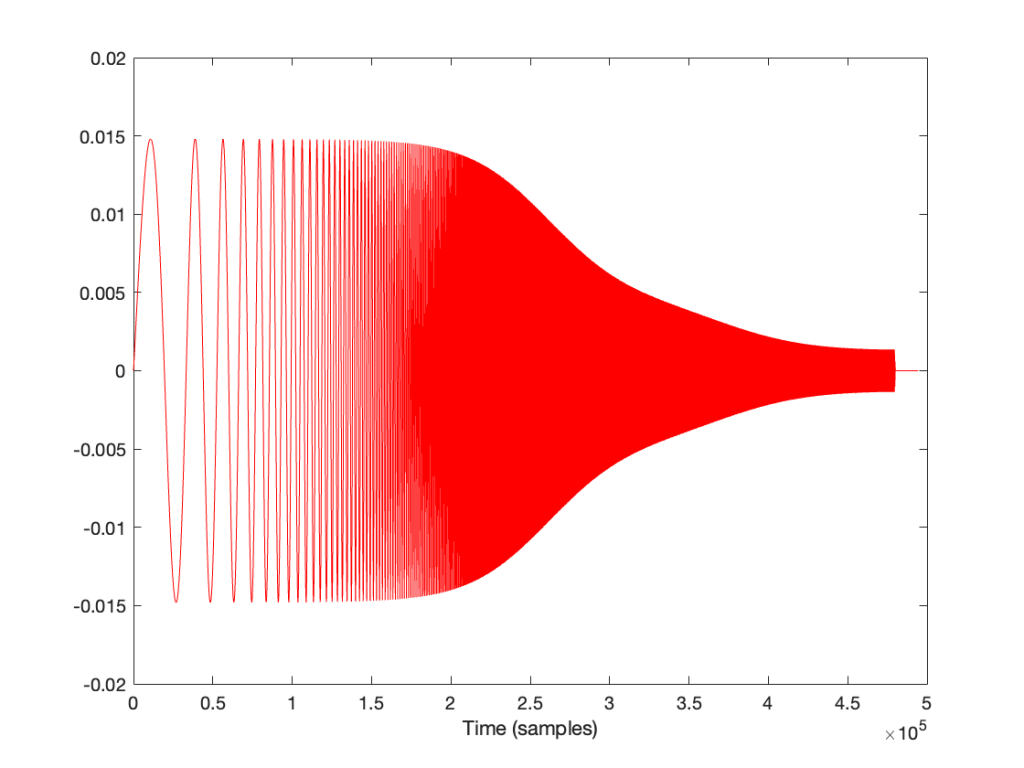
If I look at the signal that I actually send to the input of the DUT, it looks like this:
I’m normalising this to have a maximum value of 1 and then clipping it at some value like ±0.5, for example, like this:
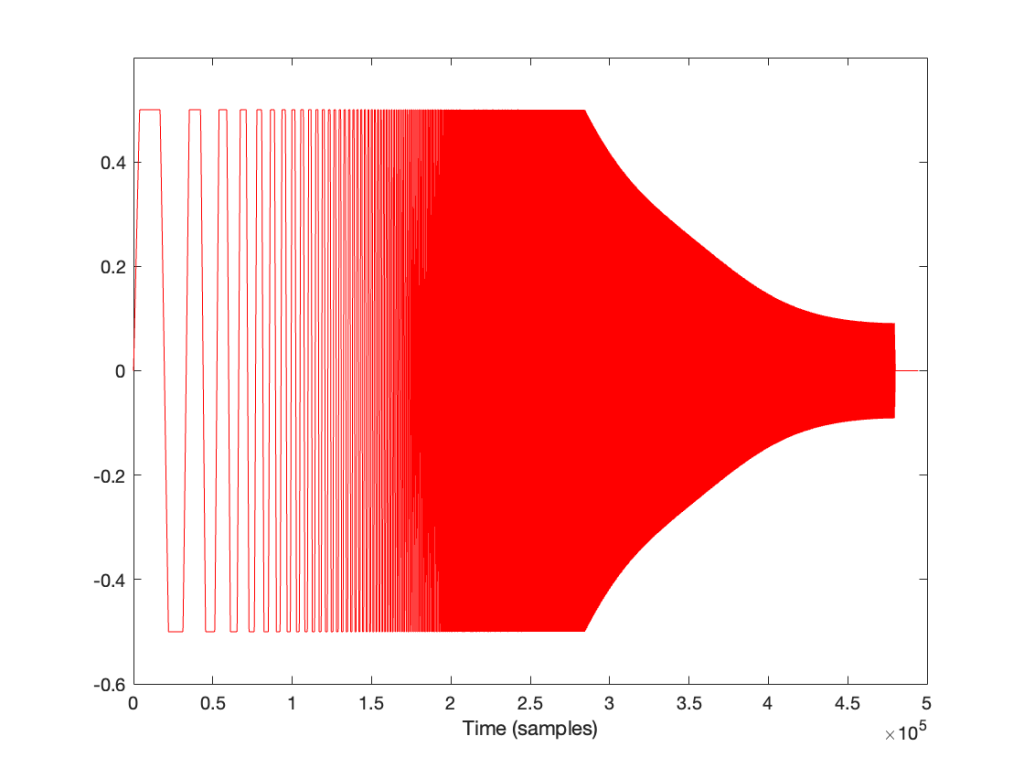
So, it should be immediately obvious that, by choosing to clip the signal at 1/2 of the maximum value of the whole sweep, I’m not clipping the entire thing. I’m only distorting signals below some frequency that is related to the level at which I’m clipping. The harder I clip, the higher the frequency I mess up.
This is why, when we look at the magnitude response, it looks like this:
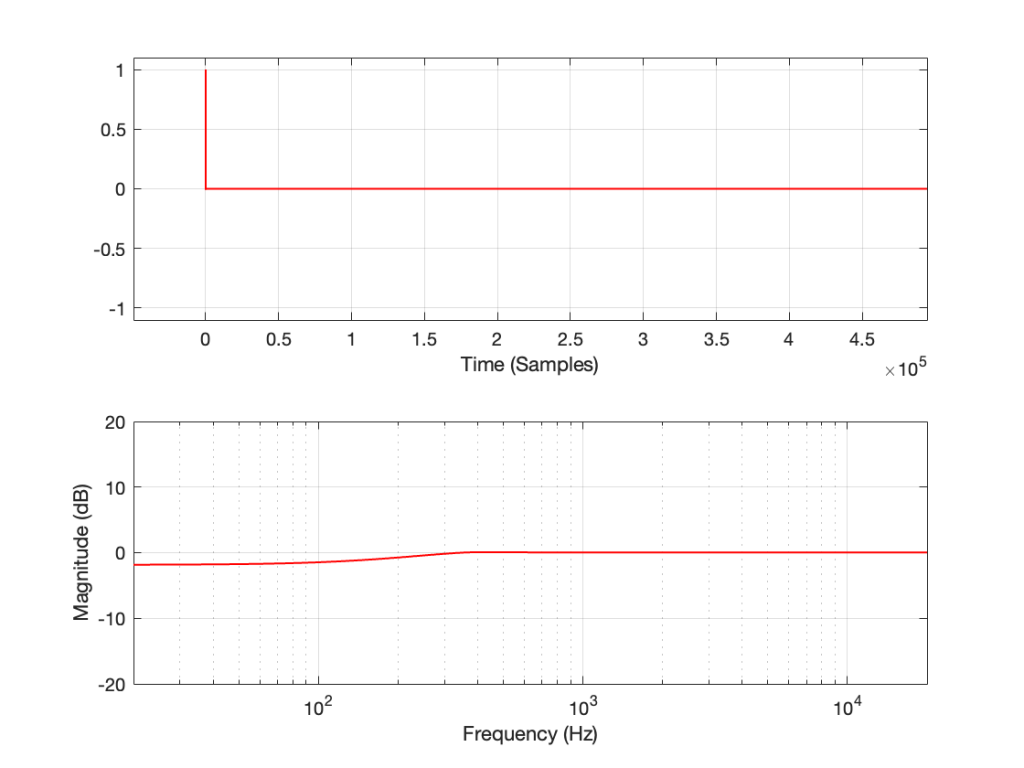
In the very low frequencies, the magnitude response is flat, but lower than expected, because the signal is clipped by the same amount. In the high frequencies, the signal is not clipped at all, so everything is behaving. In between these two bands, there is a transition between “not-behaving” and “behaving”.
This means that
- if the signal I was sending into the system was clipped by the same amount at all frequencies, OR
- if the pre-emphasis wasn’t applied to the signal, boosting the low frequencies
Then the magnitude response would look almost flat, but lower than expected (by the amount that is related to how much it’s clipped). In other words, we would (mostly) see the linear response of the system, even though it was behaving non-linearly – almost like if we had only sent a click through it.
However, if we chose to not apply the pre-emphasis to the signal, then the DUT wouldn’t be behaving the way it normally does, since this is very roughly equivalent to the spectral balance of music. For example, if you send a swept sine wave from 20 Hz to 20,000 Hz to a loudspeaker without applying that bass boost, you’ll could either get almost nothing out of your woofer, or you’ll burn out your tweeter (depending on how loudly you’re playing the sweep).
How does the result look without the pre-emphasis filter applied to the swept sine wave? For example, if we sent this to the DUT:
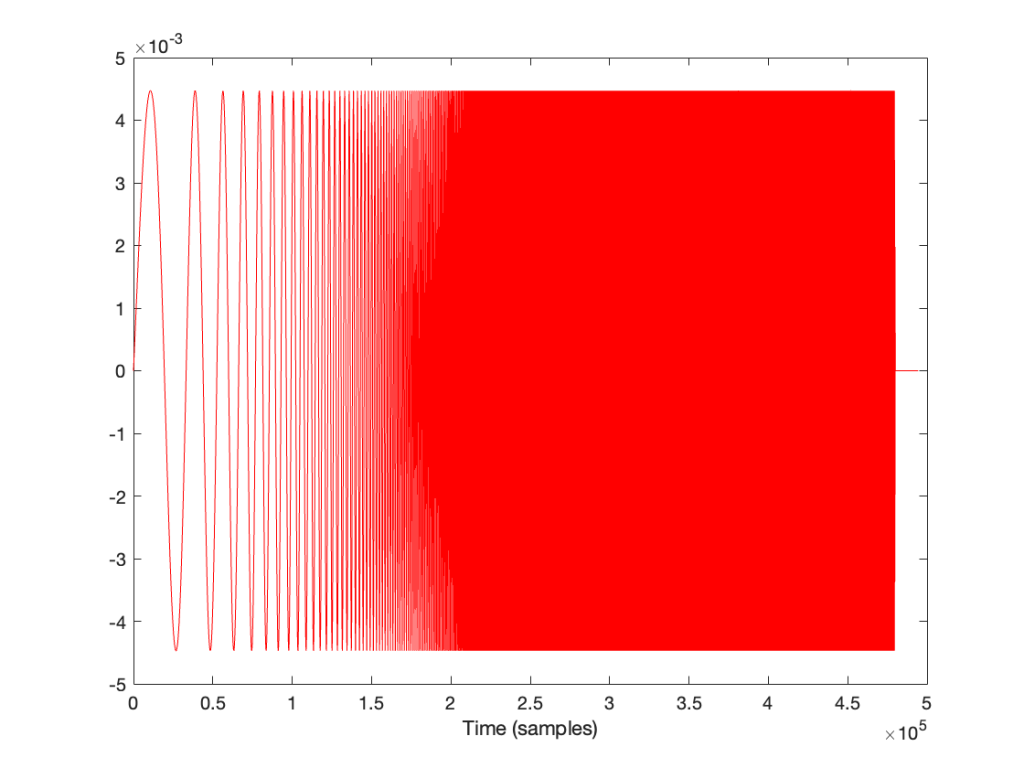
… and then we clipped it at 1/2 the maximum value, so it looks like this:
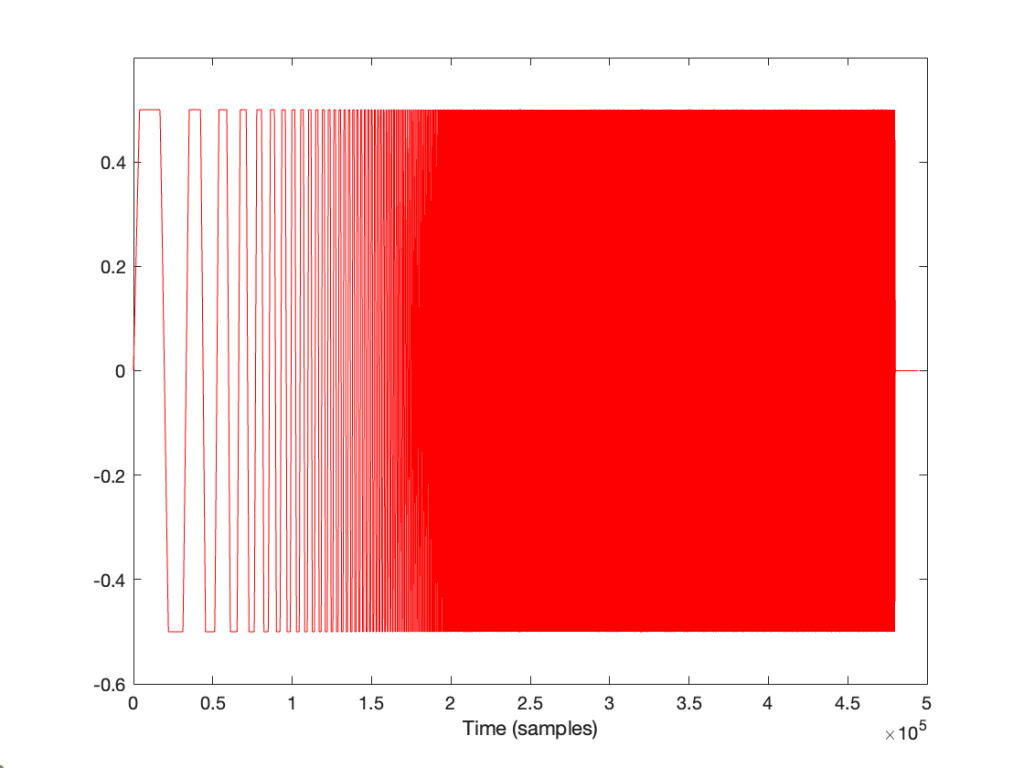
(notice that everything is clipped)
then the impulse response and magnitude response look like this instead:
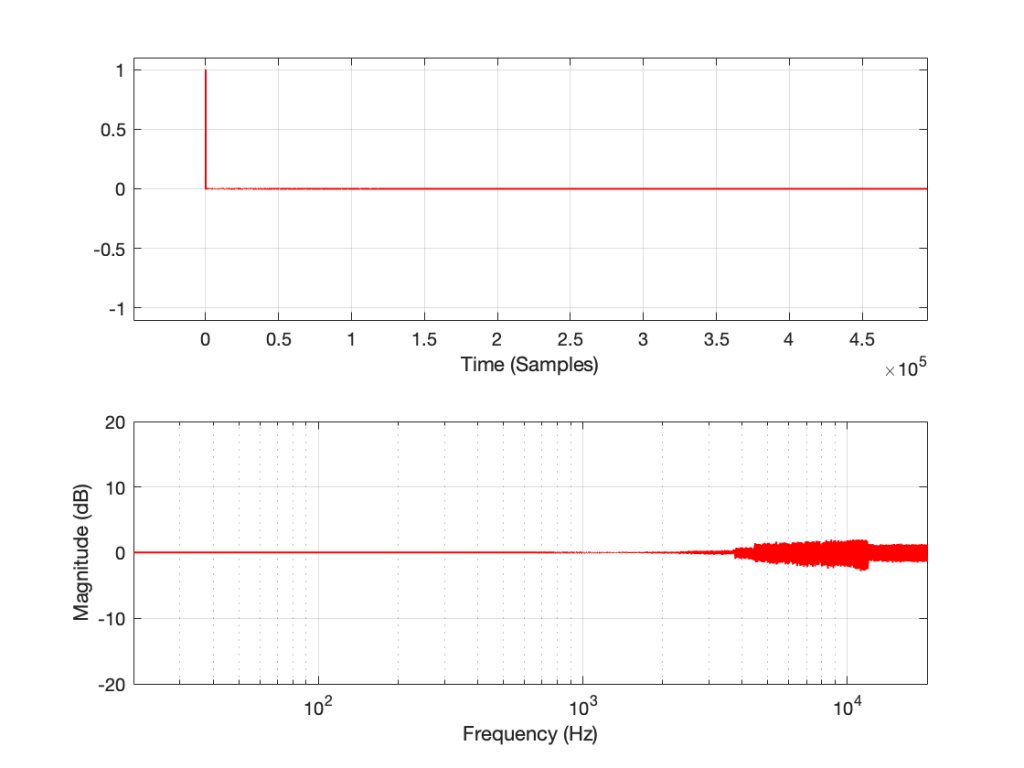
… which is more similar to the results when we clip the MLS measurement signal in that we see the effects on the top end of the signal. However, it’s still not a real representation of how the DUT “sounds” whatever that means…