The original Loudness War

The June, 1968 issue of Wireless World magazine includes an article by R.T. Lovelock called “Loudness Control for a Stereo System”. This article partly addresses the issue of resistance behaviour one or more channels of a variable resistor. However, it also includes the following statement:

It is well known that the sensitivity of the ear does not vary in a linear manner over the whole of the frequency range. The difference in levels between the threshold of audibility and that of pain is much less at very low and very high frequencies than it is in the middle of the audio spectrum. If the frequency response is adjusted to sound correct when the reproduction level is high, it will sound thin and attenuated when the level is turned down to a soft effect. Since some people desire a high level, while others cannot endure it, if the response is maintained constant while the level is altered, the reproduction will be correct at only one of the many preferred levels. If quality is to be maintained at all levels it will be necessary to readjust the tone controls for each setting of the gain control

The article includes a circuit diagram that can be used to introduce a low- and high-frequency boost at lower settings of the volume control, with the following example responses:
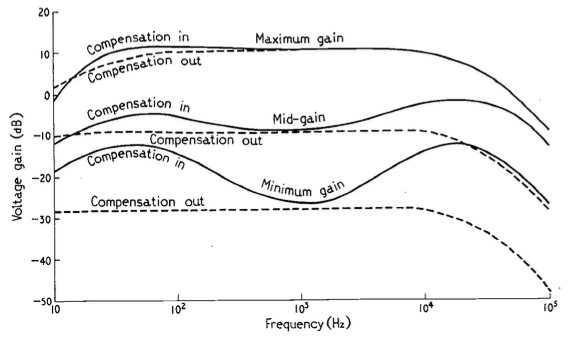
These days, almost all audio devices include some version of this kind of variable magnitude response, dependent on volume. However, in 1968, this was a rather new idea that generated some debate.

In the following month’s issue The Letters to the Editor include a rather angry letter from John Crabbe (Editor of Hi-Fi News) where he says

Mr. Lovelock’s article in your June issue raises an old bogey which I naively thought had been buried by most British engineers many years ago. I refer, not to the author’s excellent and useful thesis on achieving an accurate gain control law, but to the notion that our hearing system’s non-linear loudness / frequency behaviour justifies an interference with response when reproducing music at various levels.

Of course, we all know about Fletcher-Munson and Robinson-Dadson, etc, and it is true that l.f. acuity declines with falling sound pressure level; though the h.f. end is different, and latest research does not support a general rise in output of the sort given by Mr. Lovelock’s circuit. However, the point is that applying the inverse of these curves to sound reproduction is completely fallacious, because the hearing mechanism works the way it does in real life, with music loud or quiet, and no one objects. If `live’ music is heard quietly from a distant seat in the concert hall the bass is subjectively less full than if heard loudly from the front row of the stalls. All a `loudness control’ does is to offer the possibility of a distant loudness coupled with a close tonal balance; no doubt an interesting experiment in psycho-acoustics, but nothing to do with realistic reproduction.

In my experience the reaction of most serious music listeners to the unnaturally thick-textured sound (for its loudness) offered at low levels by an amplifier fitted with one of these abominations is to switch it out of circuit. No doubt we must manufacture things to cater for the American market, but for goodness sake don’t let readers of Wireless World think that the Editor endorses the total fallacy on which they are based.

with Lovelock replying:

Mr. Crabbe raises a point of perennial controversy in the matter of variation of amplifier response with volume. It was because I was aware of the difference in opinion on this matter that a switch was fitted which allowed a variation of volume without adjustment of frequency characteristic. By a touch of his finger the user may select that condition which he finds most pleasing, and I still think that the question should be settled by subjective pleasure rather than by pure theory.

and

Mr. Crabbe himself admits that when no compensation is coupled to the control, it is in effect a ‘distance’ control. If the listener wishes to transpose himself from the expensive orchestra stalls to the much cheaper gallery, he is, of course, at liberty to do so. The difference in price should indicate which is the preferred choice however.

In the August edition, Crabbe replies, and an R.E. Pickvance joins the debate with a wise observation:

In his article on loudness controls in your June issue Mr. Lovelock mentions the problem of matching the loudness compensation to the actual sound levels generated. Unfortunately the situation is more complex than he suggests. Take, for example, a sound reproduction system with a record player as the signal source: if the compensation is correct for one record, another record with a different value of modulation for the same sound level in the studio will require a different setting of the loudness control in order to recreate that sound level in the listening room. For this reason the tonal balance will vary from one disc to another. Changing the loudspeakers in the system for others with different efficiencies will have the same effect.

In addition, B.S. Methven also joins in to debate the circuit design.

The debate finally peters out in the September issue.

Apart from the fun that I have reading this debate, there are two things that stick out for me that are worth highlighting:

  • Notice that there is a general agreement that a volume control is, in essence, a distance simulator. This is an old, and very common “philosophy” that we forget these days.
  • Pickvance’s point is possibly more relevant today than ever. Despite the amount of data that we have with respect to equal loudness contours (aka “Fletcher and Munson curves”) there is still no universal standard in the music industry for mastering levels. Now that more and more tracks are being released in a Dolby Atmos-encoded format, there are some rules to follow. However, these are very different from 2-channel materials, which have no rules at all. Consequently, although we know how to compensate for changes in response in our hearing as a function of level, we don’t know what the reference level should be for any given recording.
3-channel vinyl

Another gem of historical information from the Centennial Issue of the JAES in 1977.

This one is from the article titled “The Recording Industry in Japan” by Toshiya Inoue of the Victor Company of Japan. In it, you can find the following:

Notice that this describes a 3-channel system developed by the Victor Company using FM with a carrier frequency of 24 kHz and a modulation of ±4kHz to create a third channel on the vinyl. The resulting signal had a bandwidth of 50 Hz to 5 kHz and a SNR of 47 dB.

Interestingly, this was developed from 1961-1965: starting 9 years before CD-4 quadraphonic was introduced to the market, which used the same basic principle of FM modulation to encode the extra channels.

Phantom imaging

The July 1968 issue of Wireless World Magazine contains a description of an early, but interesting analysis of the relationship between phantom image placement in a 2-channel stereo system and interchannel level differences. This is an old favourite topic of mine, originally inspired by the work of Michael Williams and his “Stereophonic Zoom”, and extending to my first AES paper in 1999.

If you, like me, are interested in this (for example, if you’re making a panning algorithm or you’re testing the veracity of headphone-based “virtual” systems), some important figures from that article are shown below.

The typical way of showing the relationship between IAD and phantom image placement.
This one is interesting because it shows the different results in different rooms, (which would also be influenced by loudspeaker directivity.)

Note that, for the plots above and below, the x-axes show the position of the image in the stereo sound stage, where 0 is the centre point between the two loudspeakers and 0.5 is a position in one of the two loudspeakers. This is 0.5 because it’s one-half of the total angular distance between the two loudspeakers. So, you can consider the loudspeaker aperture as ±0.5.

The relationship between image WIDTH and position. This is something I’ve not seen expressed so clearly before.

For more information similar to this, see these links as a start:

Some predictions come true

In the April, 1968 issue of Wireless World, there is a short article titled “P.C.M. Copes with Everything”

It’s interesting reading the 57-year old predictions in here. One has proven to be not-quite-correct:

While 27 levels are quite adequate for telephonic speech,
211 or 212 need to be used for high quality music.

I doubt that anyone today would be convinced that 11- or 12-bit PCM would deserve the classification of “high quality”. Although some of my earliest digital recordings were made on a Sony PCM 2500 DAT machine, with an ADC that was only reliable down to about 12 or 13 bits, I wouldn’t try to pass those off as “high quality” recordings.

But, towards the end of the article, it says:

The closing talk was given by A. H. Reeves, the inventor of p.c.m. Letting his imagination take over, he spoke of a world in the not too distant future where communication links will permit people to carry out many jobs from the comfort of their homes, conferences using closed-circuit television etc. For this, he said, reliable links capable of bit rates of the order of 109 or 1010 bits will be required. Light is the most probable answer.

Impressive that, in 1968, Reeves predicted fibre optic connections to our houses and the ability to sit at home on Teams meetings (or Facetime or Zoom or Skype, or whatever…)

B&O Tech: Reading Spec’s – Part 2

#96 in a series of articles about the technology behind Bang & Olufsen loudspeakers

Introduction

It’s been a long time (about 11 years or so…) since I wrote Part 1 in this “series”, so it’s about time that I came out with a Part 2. This one is about the ‘Maximum Sound Pressure Level (SPL)’ and the ‘Bass Capability’ values that are shown for each loudspeaker model on the Bang & Olufsen website.

Before I explain either of those numbers, we need to discuss the fact that B&O loudspeakers are fully-active. This means that all the signal processing, including simple things like the volume control and more complicated things like filtering and crossovers for the loudspeaker drivers happen in a digital signal processing (DSP) chain before the amplifiers, which are individually connected to the loudspeaker drivers. (In other words, if you see a woofer and a tweeter, then there are two amplifiers inside the loudspeaker, one for each.)

That DSP chain includes even more complicated features that help to protect the loudspeaker from abuse. This means that, even if you’re playing a signal that’s been mastered at a high level, and you’ve cranked up the volume control, the processor prevents things like:

  • letting the loudspeaker drivers exceed their maximum excursions
  • letting the amplifiers go beyond their voltage or current capabilities
  • letting the power supply try to deliver more current than it can to the entire system
  • letting the loudspeaker’s internal components get so hot that things start to melt.

(None of this means that it’s impossible to break the loudspeaker. It just means that you’d have to try a lot harder than you would with a lot of other companies’ loudspeakers.)

One important side-effect of all of those protection algorithms is that, when you play a loud signal at maximum volume, the loudspeaker will be constantly trying to protect itself. Therefore its maximum output level will vary over time, depending on the signal you’re playing and things like the temperatures of its various individual components.

This, in turn, makes it difficult to state what the “Maximum Sound Pressure Level” will be, since it will change over time with different conditions.

On the other hand, it’s necessary to give a number that states the maximum Sound Pressure Level of each loudspeaker for lots of reasons. It’s also necessary that we use the same procedure to do the measurement so that the values can be compared from loudspeaker to loudspeaker.

The method

So, how do we balance these two things? The answer is to make the measurement short enough that we show the maximum output of the loudspeakers when it’s hitting its limits without being affected by a build-up of heat. This can give you an idea of how loud a short-term signal (like the punch of a kick drum or a snare drum hit) can play: the Maximum SPL. Whatever that number is, the loudspeaker definitely can’t play louder than it (since the amplifier can’t deliver more current and the loudspeaker drivers can’t move in and out any further) but that doesn’t necessarily mean it can play at that level continuously.

The way we measure both the Maximum SPL and the Bass Capability is by placing a microphone 1 m in front of the loudspeaker, and then putting in a short ‘burst’ of 5 periods of a sinusoidal tone at a given frequency. The sound pressure level of the output is measured at the microphone’s position, we wait long enough for everything to cool down, the level of the incoming signal is increased, and then we do the measurement again. This is repeated until the output signal’s level is being automatically reduced by the loudspeaker’s protection algorithms by a pre-determined amount (-6 dB).

If we were a company that made passive loudspeakers, a normal way to do this would be to increase the level until we reached a pre-determined level of total harmonic distortion (say, 10% or 20% THD, for example). However, this won’t work for a B&O loudspeaker because the protection algorithms probably won’t allow the product to distort enough to have a usable threshold.

What’s the difference?

Generally, the method of measuring both the Maximum SPL and the Bass Capability values are the same. The only difference is the range of frequencies that are used for each.

The Bass Capability shows the maximum SPL of the loudspeaker when the input signal is a 50 Hz sinusoidal wave.*

The Maximum Sound Pressure Level is an average of the maximum SPL of the loudspeaker when it is measured using a number of sinusoidal signals ranging from 200 Hz to 2 kHz. Each frequency is measured individually, and the resulting maxima are averaged to produce a single value. (If you’re read Part 1, then the frequency range of this measurement will look familiar.)

How does this correspond to real life?

This is a difficult question to answer, since the measurement is done on-axis to (or ‘directly in front of’) the loudspeaker in the measurement room. This measurement room is different from a ‘normal’ living room, where more of the total power of the loudspeaker that’s radiated in all three dimensions is reflected back to the listening position. This is the reason why some companies list the maximum output level of their loudspeakers with two numbers: one in a ‘free field’ (a room or ‘field’ that is ‘free’ of reflections) and the other in a ‘listening room’ (which may or may not be like your listening room). You’ll probably see that the ‘listening room’ SPL is higher than the ‘free field’ SPL because the room is reflecting more energy back to the measurement microphone, if nothing else…

In other words ‘results may vary’. So, the maximum SPL of a loudspeaker in your living room may not be the same as the Maximum SPL that B&O lists on its website. Time frames are different, signals are different, and rooms are different: and all of these have significant effects on the result.

What happens when I have more than one loudspeaker?

Generally speaking, if your loudspeakers are reasonably far apart, then you can use a simple rule to calculate the maximum SPL if you add more loudspeakers.

+ 3 dB per doubling

In other words, if you have a loudspeaker that can hit 100 dB SPL, and you add a second loudspeaker, then you’ll hit 103 dB SPL. If you then add two more loudspeaker (another doubling of the total number) you’ll hit 106 dB SPL.

This rule is based on a number of assumptions:

  • the loudspeakers are all the same type
  • the loudspeakers are in the same room, but fairly far apart
  • the loudspeakers are all playing their maximum output levels at the same time
  • I’m ignoring room modes, which might make things louder or quieter, depending on the frequency that you’re playing, the placements of the loudspeakers, and the location of the listening position
  • we’re ignoring other protection algorithms like thermal protection

The reason that this rule is a basic one: we’re assuming that every time you double the number of speakers, you double the total power at the listening position (which is a reasonable assumption if the list of assumptions above are true). Two times the acoustic power is the same as an increase of +3 dB SPL (because 10 log10(2) = 3).

If, however, the frequency was very low, and the loudspeakers were very close together, and they were playing exactly the same signals at exactly the same time, you might make the argument that you can say that there is a +6 dB increase for every doubling of loudspeakers, because it’s their amplitudes (and not their acoustic powers) that are added.

Neither of these two basic assumptions is correct, and so the real number is probably between +3 and +6 dB per doubling of loudspeakers, and it will be different for different frequency bands and different loudspeaker separations. However, it’s best to err on the safe side.

One last thing

This should help to explain why, when you compare the Bass Capabilities and the Maximum Sound Pressure Levels of different loudspeakers, the former has much bigger differences than the latter.

For example:

Beosound Explore< difference >Beolab 50
Max SPL @ 1 m91 dB SPL26 dB117 dB SPL
Bass capability59 dB SPL52 dB111 dB SPL

The table above shows a direct comparison of two VERY different loudspeaker models using data taken directly from bang-olufsen.com on 2025 04 01. I’ve converted the numbers for the Beolab 50 to a ‘per loudspeaker’ instead of ‘per pair’ by subtracting 3 dB from the published numbers.

As you can see there:

  • the difference in Bass Capability between a Beosound Explore and a Beolab 50 is (111-59) = 52 dB
  • the difference in Max SPL between a Beosound Explore and a Beolab 50 is (117-91) = 26 dB

Speaking VERY generally, the difference in Max SPL values is less than the difference in Bass Capabilities because the difference in size and power of the drivers producing the midrange frequency band of the two loudspeakers is smaller than the difference in size and power of the woofers. In other words, there is a difference between the different differences. (I think that I got that right…)


* To get the Bass Capability measurement, it looks like I said that we do the measurement of a single 50 Hz sinusoidal tone. This isn’t really true. We do a number of measurements at different frequencies ranging from 20 Hz to 100 Hz and then calculate the equivalent value for a 50 Hz tone using some averaging.

If the loudspeaker is comprised of a single low-frequency driver in a closed cabinet, then the resulting number would be the same as if we just measured using a 50 Hz tone. However, if the loudspeaker is ported or has a passive driver with a resonant frequency in the 20 – 100 Hz range, then this method will probably produce a slightly different number than measuring only with a 50 Hz tone.

The Sound of Music

This episode of The Infinite Monkey Cage is worth a listen if you’re interested in the history of recording technologies.

There’s one comment in there by Brian Eno that I COMPLETELY agree with. He mentions that we invented a new word for moving pictures: “movies” to distinguish them from the live equivalent, “plays”. But we never really did this for music… Unless, of course, you distinguish listening to a “concert” from listening to a “recording” – but most of us just say “I’m listening to music”.

100-year old upmixer

I had a little time at work today waiting for some visitors to show up and, as I sometimes do, I pulled an old audio book off the shelf and browsed through it. As usually happens when I do this, something interesting caught my eye.

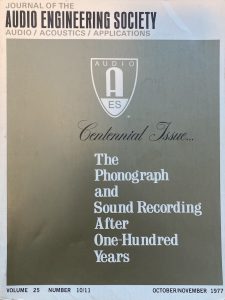
I was reading the AES publication called “The Phonograph and Sound Recording After One-Hundred Years” which was the centennial issue of the Journal of the AES from October / November 1977.

In that issue of the JAES, there is an article called “Record Changers, Turntables, and Tone Arms – A Brief Technical History” by James H. Kogen of Shure Brothers Incorporated, and in that article he mentions US Patent Number 1,468,455 by William H. Bristol of Waterbury, CT, titled “Multiple Sound-Reproducing Apparatus”.

Before I go any further, let’s put the date of this patent in perspective. In 1923, record players existed, but they were wound by hand and ran on clockwork-driven mechanisms. The steel needle was mechanically connected to a diaphragm at the bottom of a horn. There were no electrical parts, since lots of people still didn’t even have electrical wiring in their homes: radios were battery-powered. Yes, electrically-driven loudspeakers existed, but they weren’t something you’d find just anywhere…

In addition, 3- or 2-channel stereo wasn’t invented yet, Blumlein wouldn’t patent a method for encoding two channels on a record until 1931: 8 years in the future…

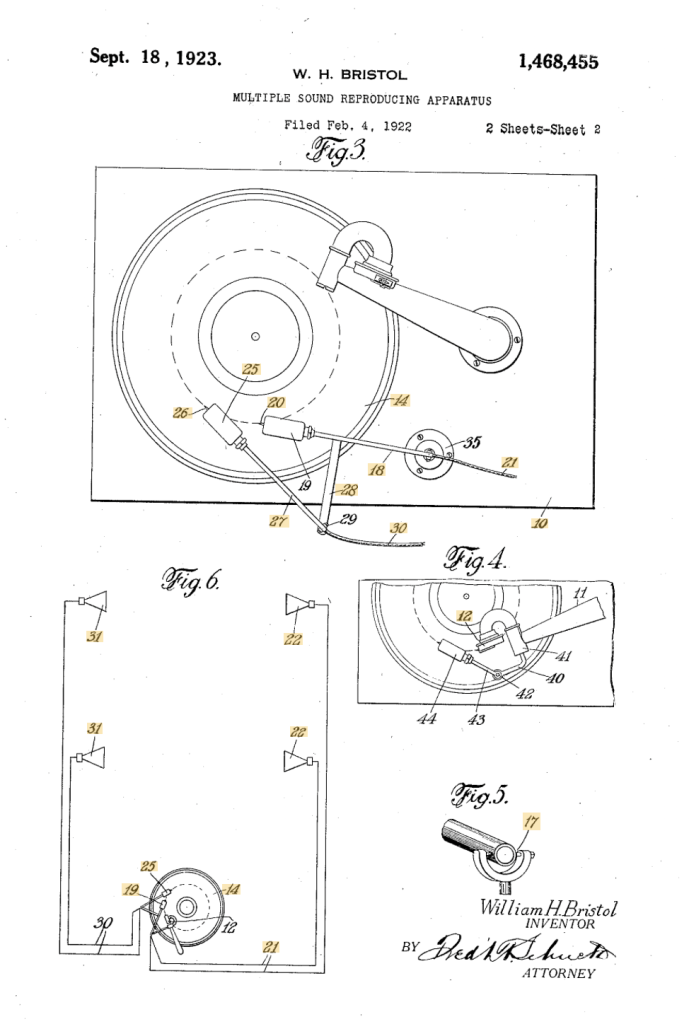
But, if we look at Bristol’s patent, we see a couple of astonishing things, in my opinion.

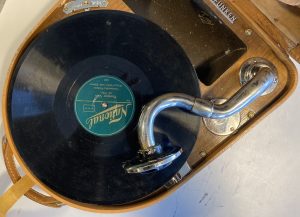
If you look at the top figure, you can see the record, sitting on the gramophone (I will not call it a record player or a turntable…). The needle and diaphragm are connected to the base of the horn (seen on the top right of Figure 3, looking very much like my old Telefunken Lido, shown below.

But, below that, on the bottom of Figure 3 are what looks a modern-ish looking tonearm (item number 18) with a second tonearm connected to it (item number 27). Bristol mentions the pickups on these as “electrical transmitters”: this was “bleeding edge” emerging technology at the time.

So, why two pickups? First a little side-story.

Anyone who works with audio upmixers knows that one of the “tricks” that are used is to derive some signal from the incoming playback, delay it, and then send the result to the rear or “surround” loudspeakers. This is a method that has been around for decades, and is very easy to implement these days, since delaying audio in a digital system is just a matter of putting the signal into a memory and playing it out a little later.

Now look at those two tonearms and their pickups. As the record turns, pickup number 20 in Figure 3 will play the signal first, and then, a little later, the same signal will be played by pickup number 26.

Then if you look at Figure 6, you can see that the first signal gets sent to two loudspeakers on the right of the figure (items number 22) and the second signal gets sent to the “surround” loudspeakers on the left (items number 31).

So, here we have an example of a system that was upmixing a surround playback even before 2-channel stereo was invented.

Mind blown…

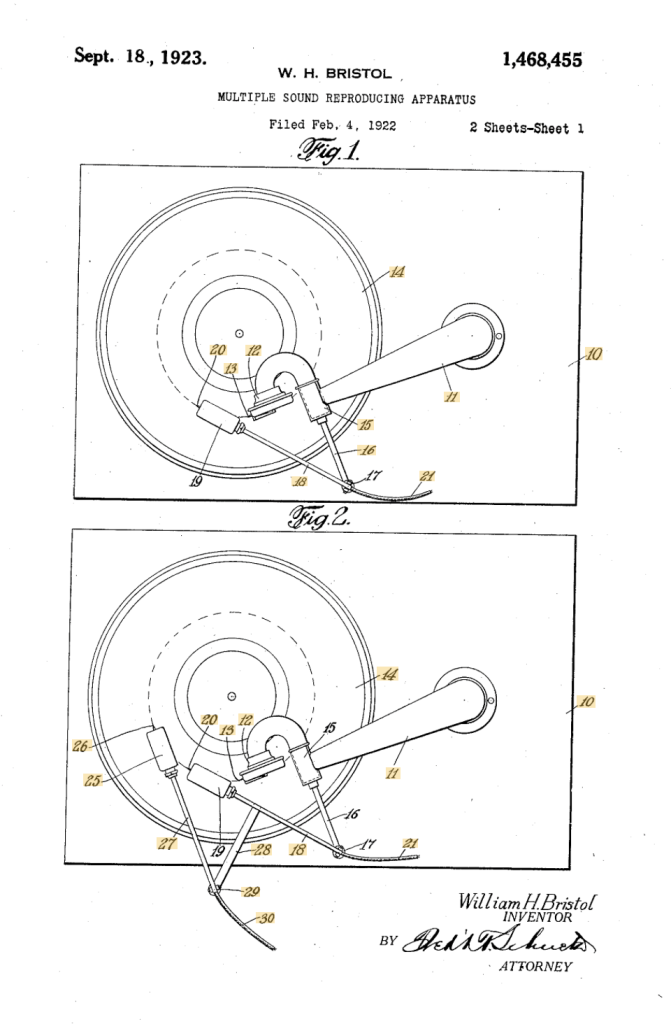
NB. If you look at Figure 4, you can see that he thought of making the system compatible with the original needle in the horn. This is more obvious in Figures 1 and 2, shown below.

Bit depth conversion: Part 5

One of the things I have to do occasionally is to test a system or device to make sure that the audio signal that’s sent into it comes out unchanged. Of course, this is only one test on one dimension, but, if the thing you’re testing screws up the signal on this test, then there’s no point in digging into other things before it’s fixed.

One simple way to do this is to send a signal via a digital connection like S/PDIF through the DUT, then compare its output to the signal you sent, as is shown in the simple block diagram in Figure 1.

Figure 1: Basic block diagram of a Device Under Test

If the signal that comes back from the DUT is identical to the signal that was sent to it, then you can subtract one from the other and get a string of 0s. Of course, it takes some time to send the signal out and get it back, so you need to delay your reference signal to time-align them to make this trick work.

The problem is that, if you ONLY do what I described above (using something like the patcher shown in Figure 2) then it almost certainly won’t work.

Figure 2: The wrong way to do it

The question is: “why won’t this work?” and the answer has very much to do with Parts 1 through 4 of this series of postings.

Looking at the left side of the patcher, I’m creating a signal (in this case, it’s pink noise, but it could be anything) and sending it out the S/PDIF output of a sound card by connecting it to a DAC object. That signal connection is a floating point value with a range of ±1.0, and I have no idea how it’s being quantised to the (probably) 24 bits of quantisation levels at the sound card’s output.

That quantised signal is sent to the DUT, and then it comes back into a digital input through an ADC object.

Remember that the signal connection from the pink noise output across to the latency matching DELAY object is a floating point signal, but the signal coming into the ADC object has been converted to a fixed point signal and then back to a floating point representation.

Therefore, when you hit the subtraction object, you’re subtracting a floating point signal from what is effectively a fixed point quantised signal that is coming back in from the sound card’s S/PDIF input. Yes, the fixed point signal is converted to floating point by the time it comes out of the ADC object – but the two values will not be the same – even if you just connect the sound card’s S/PDIF output to its own input without an extra device out there.

In order to give this test method a hope of actually working, you have to do the quantisation yourself. This will ensure that the values that you’re sending out the S/PDIF output can be expected to match the ones you’re comparing them to internally. This is shown in Figure 3, below.

Figure 3: A better way to do it

Notice now that the original floating point signal is upscaled, quantised, and then downscaled before its output to the sound card or routed over to the comparison in the analysis section on the right. This all happens in a floating point world, but when you do the rounding (the quantisation) you force the floating point value to the one you expect when it gets converted to a fixed point signal.

This ensures that the (floating point) values that you’re using as your reference internally CAN match the ones that are going through your S/PDIF connection.

In this example, I’ve set the bit depth to 16 bits, but I could, of course, change that to whatever I want. Typically I do this at the 24-bit level, since the S/PDIF signal supports up to 24 bits for each sample value.

Be careful here. For starters, this is a VERY basic test and just the beginning of a long series of things to check. In addition, some sound cards do internal processing (like gain or sampling rate conversion) that will make this test fail, even if you’re just doing a loop back from the card’s S/PDIF output to its own input. So, don’t copy-and-paste this patcher and just expect things to work. They might not.

But the patcher shown in Figure 2 definitely won’t work…

One small last thing

You may be wondering why I take the original signal and send it to the right side of the “-” object instead of making things look nice by putting it in the left side. This is because I always subtract my reference signal from the test signal and not the other way around. Doing this every time means that I don’t have to interpret things differently every time, trying to figure out whether things are right-side-up or upside-down.

Bit depth conversion: Part 4

Converting floating point to fixed point

It is often the case that you have to convert a floating point representation to a fixed point representation. For example, you’re doing some signal processing like changing the volume or adding equalisation, and you want to output the signal to a DAC or a digital output.

The easiest way to do this is to just send the floating point signal into the DAC or the S/PDIF transmitter and let it look after things. However, in my experience, you can’t always trust this. (I’ll explain why in a later posting in this series.) So, if you’re a geek like me, then you do this conversion yourself in advance to ensure you’re getting what you think you’re getting.

To start, we’ll assume that, in the floating point world, you have ensured that your signal is scaled in level to have a maximum amplitude of ± 1.0. In floating point, it’s possible to go much higher than this, and there’re no serious reason to worry going much lower (see this posting). However, we work with the assumption that we’re around that level.

So, if you have a 0 dB FS sine wave in floating point, then its maximum and minimum will hit ±1.0.

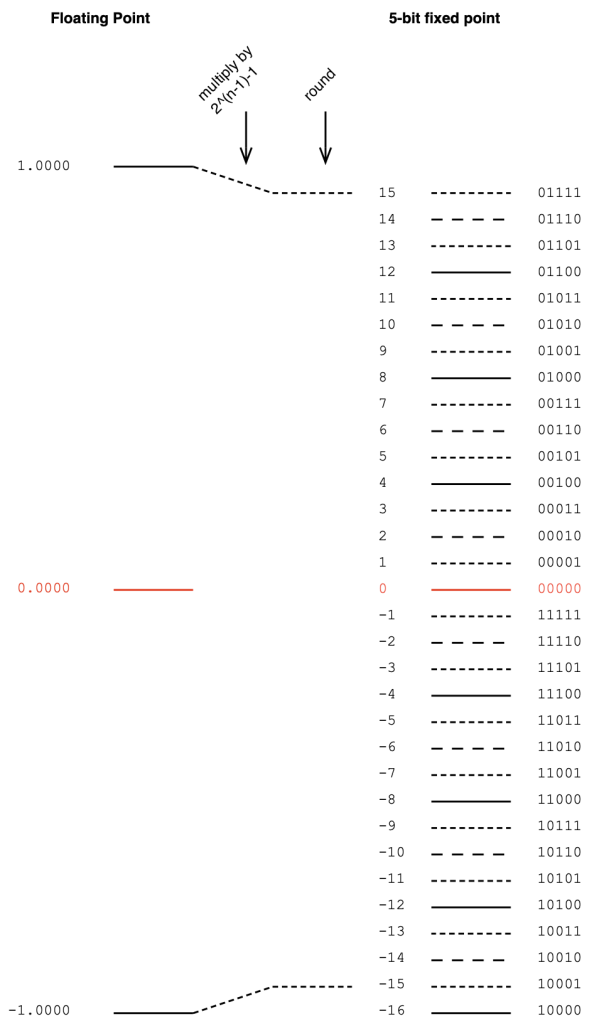
Then, we have to convert that signal with a range of ±1.0 to a fixed point system that, as we already know, is asymmetrical. This means that we have to be a little careful about how we scale the signal to avoid clipping on the positive side. We do this by multiplying the ±1.0 signal by 2^(nBits-1)-1 if the signal is not dithered. (Pay heed to that “-1” at the end of the multiplier.)

Let’s do an example of this, using a 5-bit output to keep things on a human scale. We take the floating point values and multiply each of them by 2^(5-1)-1 (or 15). We then round the signals to the nearest integer value and save this as a two’s complement binary value. This is shown below in Figure 1.

Figure 1. Converting floating point to a 5-bit fixed point value without dither.

As should be obvious from Figure 1, we will never hit the bottom-most fixed point quantisation level (unless the signal is asymmetrical and actually goes a little below -1.0).

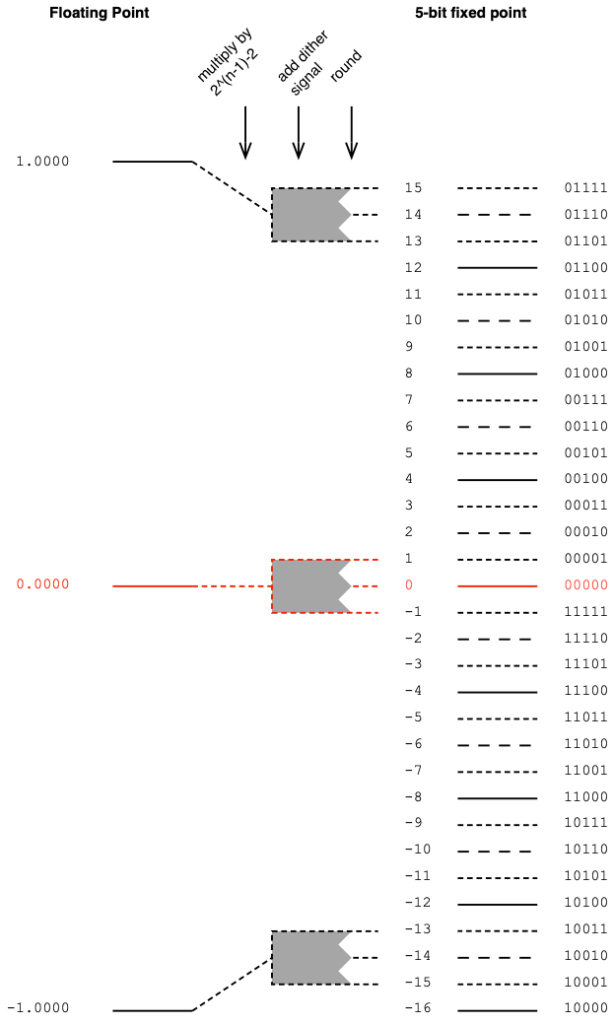
If you choose to dither your audio signal, then you’re adding a white noise signal with an amplitude of ±1 quantisation level after the floating point signal is scaled and before it’s rounded. This means that you need one extra quantisation level of headroom to avoid clipping as a result of having added the dither. Therefore, you have to multiply the floating point value by 2^(nBits-1)-2 instead (notice the “-2” at the end there…) This is shown below in Figure 2.

Figure 2. Converting floating point to a 5-bit fixed point value with dither.

Of course, you can choose to not dither the signal. Dither was a really useful thing back in the days when we only had 16 reliable bits to work with. However, now that 24-bit signals are normal, dither is not really a concern.