Filters and Ringing: Part 2

Rocks, Guitars, and Children

If you throw a rock into a pond on a windless day, you’ll see the ripples moving away in an expanding circle from the place where the rock hit. The ripples are places on the water where the water is either higher or lower than where it was before you hit the rock. The water itself only moves up and down, but the waves expand sideways. (You can see this if there is something floating on the water, for example – it bobs up and down as the waves go by.)

A similar thing happens when you pluck a guitar string. The point where your finger plucked is the same as the point where the rock landed in the water, and waves radiate away from that place on the string in two directions (because there are only two directions to travel in on a string: this way and that way). However, when those waves reach the end of the string, they reflect and come back in the opposite direction.

In both cases, the water and the guitar string, the wave has some speed at which it travels. It’s slow enough on the water for you to watch it, but it’s much too fast on a guitar string. In fact, it’s so fast that, when you pluck it, the wave travels to the end of the string, reflects in the opposite direction, hits the other end of the string, reflects again, and gets back to where you plucked it in about 1/82nd of a second if it’s the low E string. Since the wave doesn’t stop there – it keeps going, repeating the back-and-forth journey along the length of the string every 1/82nd of a second, then we hear a note with a fundamental frequency of 82 Hz (82 cycles per second): a low E.

That ringing that happens on the guitar string will happen no matter how you start the movement on it. You could hit the string with a chopstick, you could just thump the side of the guitar with your fist, you could even stand next to the guitar and cough loudly. All of these things will “inject” energy into the string, causing it to move, and the wave starts banging back and forth.

The rate of repetition is dependent on two things: the length of the string and the speed of the wave. The speed of the wave is dependent on two things: the mass of the string (e.g. how heavy is 1 m of it?) and the tension (how tightly is it stretched?) Increase the tension, and you increase the speed of the wave. Decrease the mass and you increase the speed of the wave. Increase the speed of the wave, and the repetition takes less time, so you hear a higher note.

That frequency at which the string will naturally ring is called a resonance. A child on a swing will go back and forth at the same rate (number of times per second) no matter how gently or forcefully you push them – apply energy, and the system will resonate.

Now, let’s think about that push of the child, the rock hitting the water, or the pluck of the guitar string. All of those things are a short injection of energy: a kind of impulse, and the way the child, the water, or the string behaves afterwards is its impulse response – how it responds to that impulse.

But here’s a strange thing to consider. This means that the note (the frequency) that you hear from the guitar string was one of the many frequencies in the initial pluck itself.

So, another way to think of this is that, by plucking the string, you inject a signal with all frequencies in it, and all of those frequencies decay (“die away”) very quickly except for one.

Okay, okay, if we’re going to be pedantic, I should be including not only the fundamental frequency but all of the additional harmonics; typically multiples of that frequency. But we don’t need to complicate things with the truth at the moment…

What does this have to do with filters?

From a “big picture” point of view, a guitar string is a filter. I feed in some signal (the pluck) and I get out a modified version of that signal (the note ringing). From the same perspective, a filter in an equaliser is the same: I feed in a signal (music) and I get out a modified version of it (the same music, but slightly louder at 1 kHz, for example). What’s interesting is that the two things basically work the same way.

Let’s take the example of the filter at the end of Part 1: a peaking filter with a boost of 12 dB at 1 kHz, with a Q of 2. If I feed in a sine wave (which only contains energy at 1 frequency) at a very low frequency (say, 100 Hz or lower) then the level of the output will equal that of the input. If I do the same with a very high frequency (say, 10 kHz) then the level of the output will also equal that of the input. However, if I feed in a sine wave at 1 kHz, the output will be 4 times louder than the input (+12 dB = 4 time the amplitude because 20*log10(4) = 12-ish).
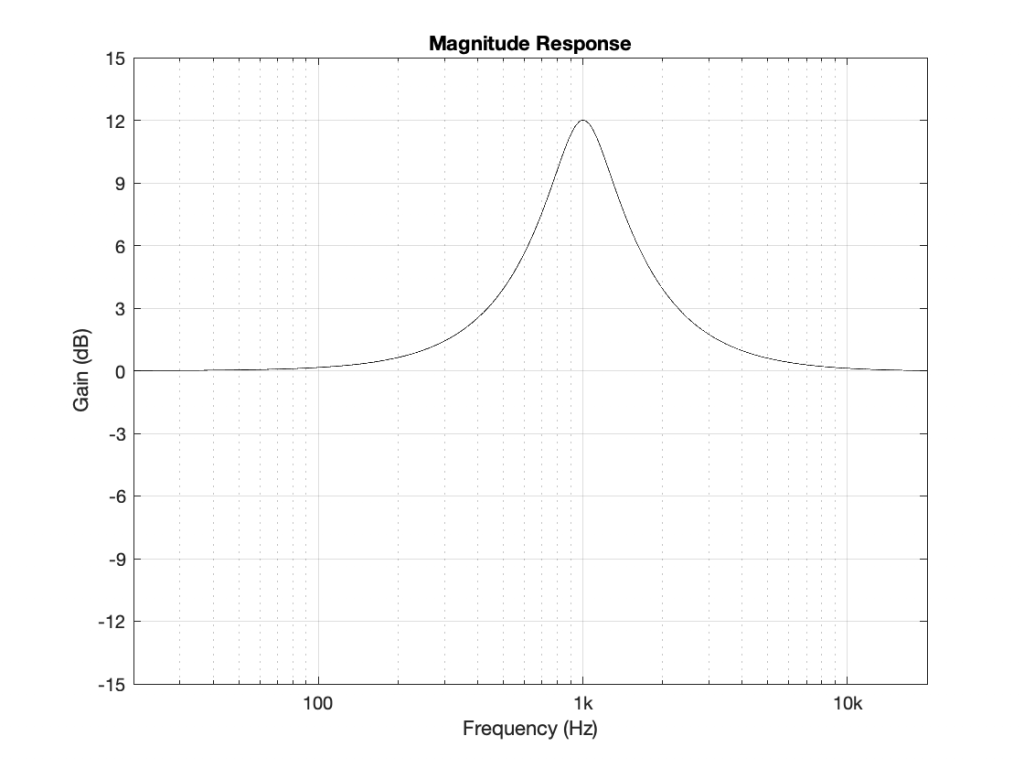
Fig 1. The magnitude response of the example filter that we’re working with for now.

At some other frequency around 1 kHz, I’ll get a different answer. However, this is a VERY long and tedious way to measure the magnitude response of the filter. Another option is to measure its impulse response.

If I feed the input of the filter with an impulse (which is a sound that contains all frequencies at the same level, as we saw in Part 1), and look at the filters output in time, it might look like this:

Fig 2. The impulse response of the example filter from Fig 1.

Notice that the impulse looks like an impulse at Time = 0, but then something extra happens afterwards – like a guitar string ringing in time. If I zoom in vertically and look at the same plot, it will look like Figure 3.

Fig 3. The same data shown in Figure 2, but zoomed in vertically.

And if we zoom in horizontally as well, it will look like this.
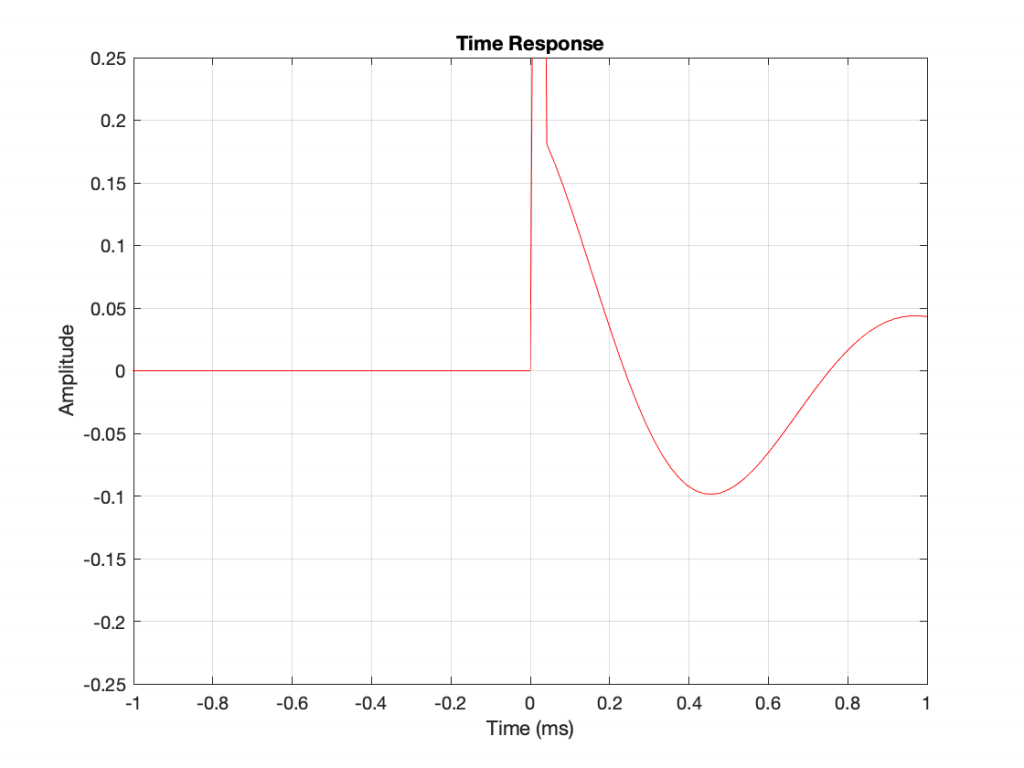
Fig 4. The same data again, focusing on the initial part of the response

So, as you can see there, it’s almost as if we kept the impulse, and then just added a cosine wave with a period (a repetition time) of 1 ms, starting at Time = 0 and decaying over time. In fact, that’s exactly what the filter does.

Time response to Frequency response

The excuse I gave above for sending an impulse through the filter (instead of sine waves) was that this will be a faster way to measure its response. The time response of the filter is already done. We can see that in the figures above. But how do we see the filter’s frequency response? This is done using a clever bit of math called a Fourier Transform, which lets you take a signal in time, and analyse its content by frequency. I won’t explain that here, but if you’re interested in how it works, you can start by reading this.

If I take the total impulse response (also known as a time response measurement) of the filter: in other words, I send in an impulse, I record the output and don’t stop recording until the ringing has decayed to a level low enough that I no longer care (for the purposes of this discussion, at least). Then, I do a Fourier Transform of the recording, I get something like Figure 5.
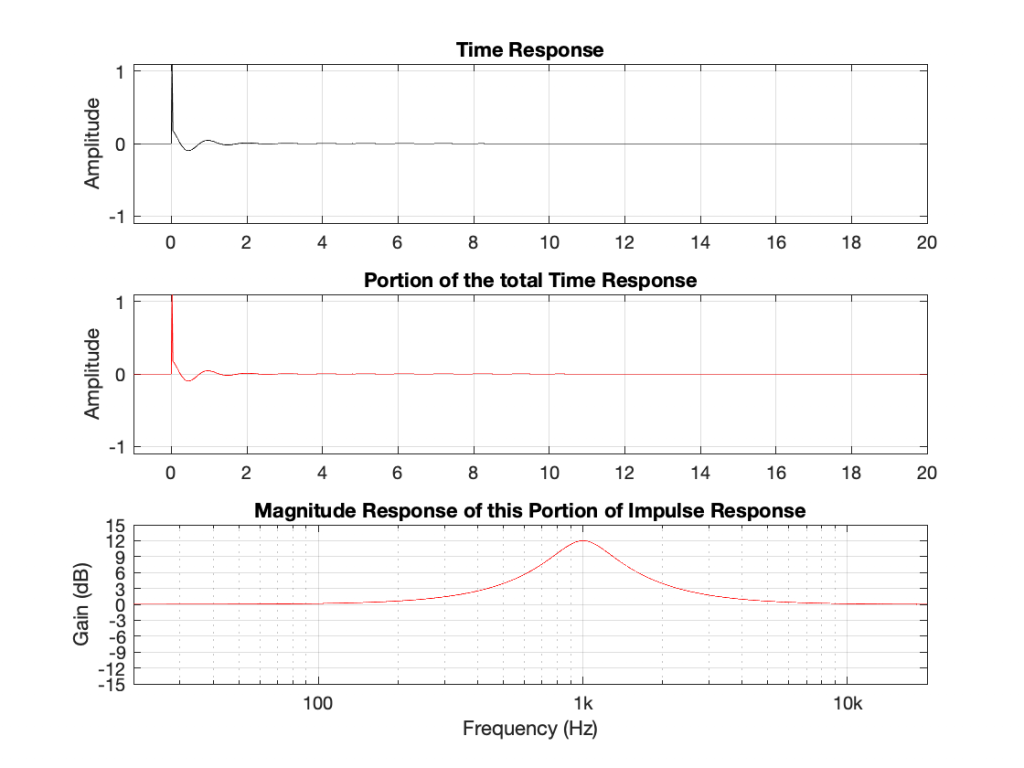
Fig 5. In this example, the “portion” of the time response that I’ve used is the entire time response. Bear with me.

There is no new information in Figure 5. It’s just a setup for Figures 6 and 7.

Let’s now start slicing up the time response selectively to see what frequencies are contained in the output of the filter at what time. We’ll start by just taking the first and second samples of the impulse at the output, shown in Figure 6.
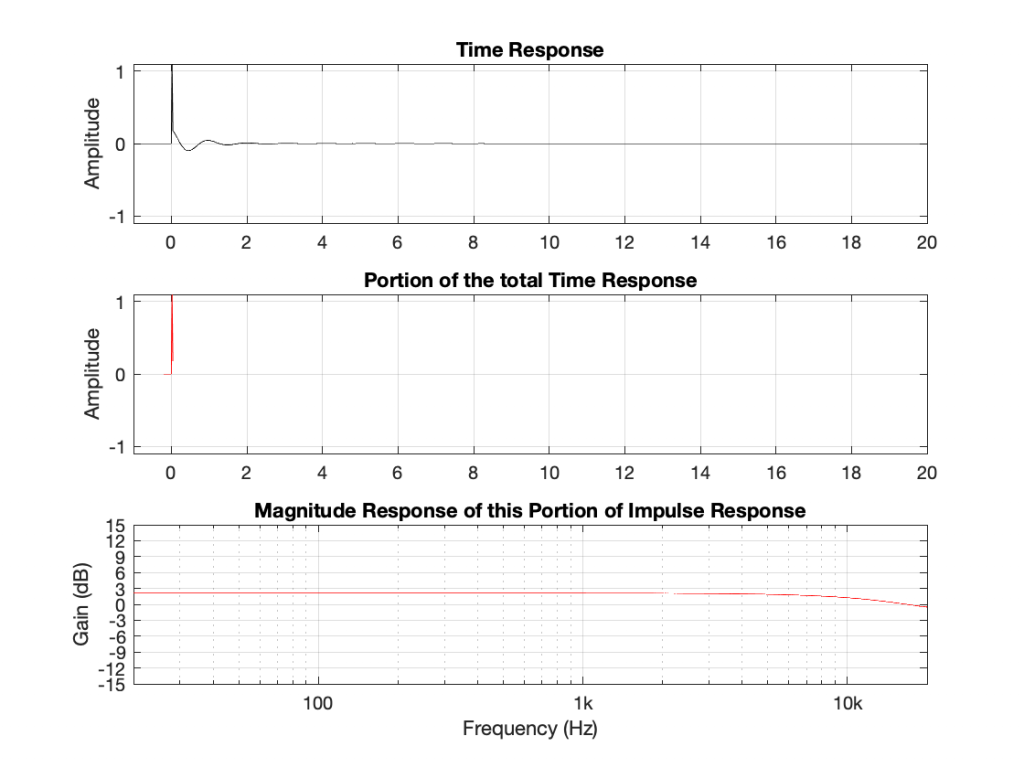
Fig 6. The magnitude response is a measurement of ONLY the first 2 samples of the impulse, which are shown in the middle plot.

As you can see in Figure 6, if I remove the ringing that comes after the impulse, then the response of the signal has an almost-flat magnitude response and a gain of about 2 dB or so. This should not come as a surprise, since it’s almost an impulse. The only real difference between the portion that I’ve used and a real impulse is that the second value is not 0. So far so good…

Let’s look at the remainder of the time response. This is shown in Figure 7.
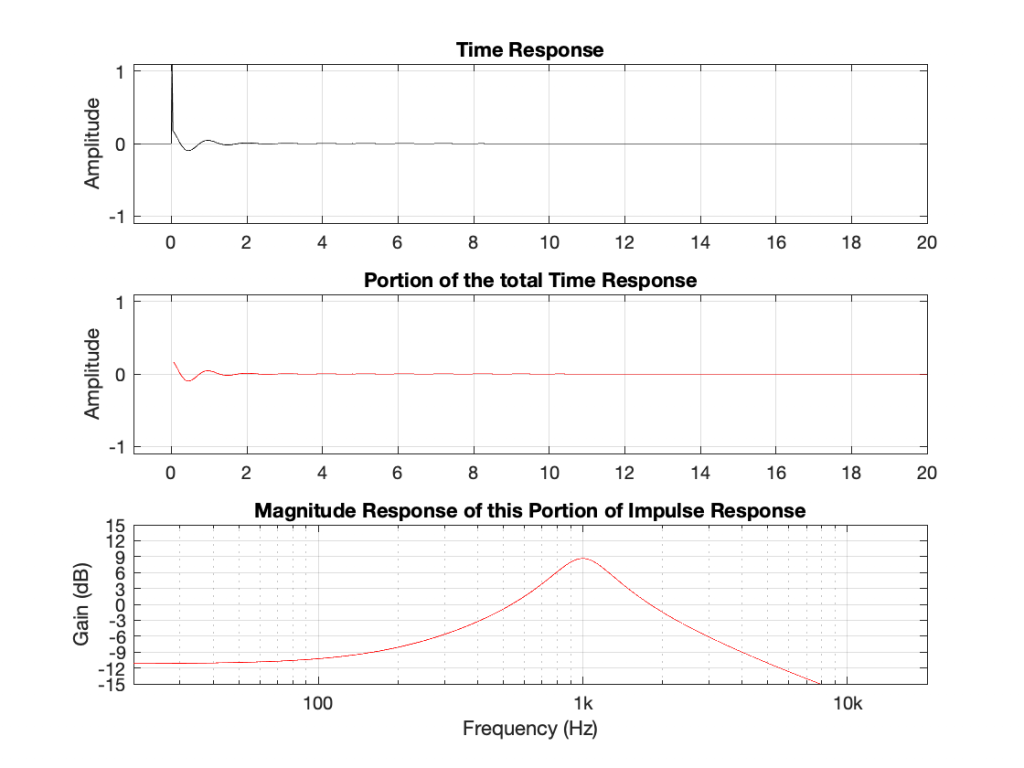
Fig 7. The magnitude response of the remaining portion of the time response, omitting the initial onset of the impulse.

Figure 7 shows something interesting. We see the response of a band-pass filter with a centre frequency of 1 kHz, and a gain of 9 dB, which is the response of the filter after the initial impulse has passed.

What does this all mean!?

If we leave out one important thing for now, this means that a peaking filter that has a boost of 12 dB, an Fc of 1 kHz and a Q of 2 is actually the sum of two things:

  • a through-put with a little gain (about 1 dB)
  • a bandpass filter with a gain of about 9 dB

This is, in essence, true. You can create a peaking filter by summing a bandpass filter to a through-put. However, an important point to realise here is that the band pass signal essentially comes after the onset of the signal. In Part 3, we’ll talk about whether this is a problem – or, more accurately, when this might be a problem. For now, however, I’ll throw one more example at you.

Up to now, we’ve only looked at the example of a peaking filter with a boost. What happens when the filter has a cut instead?
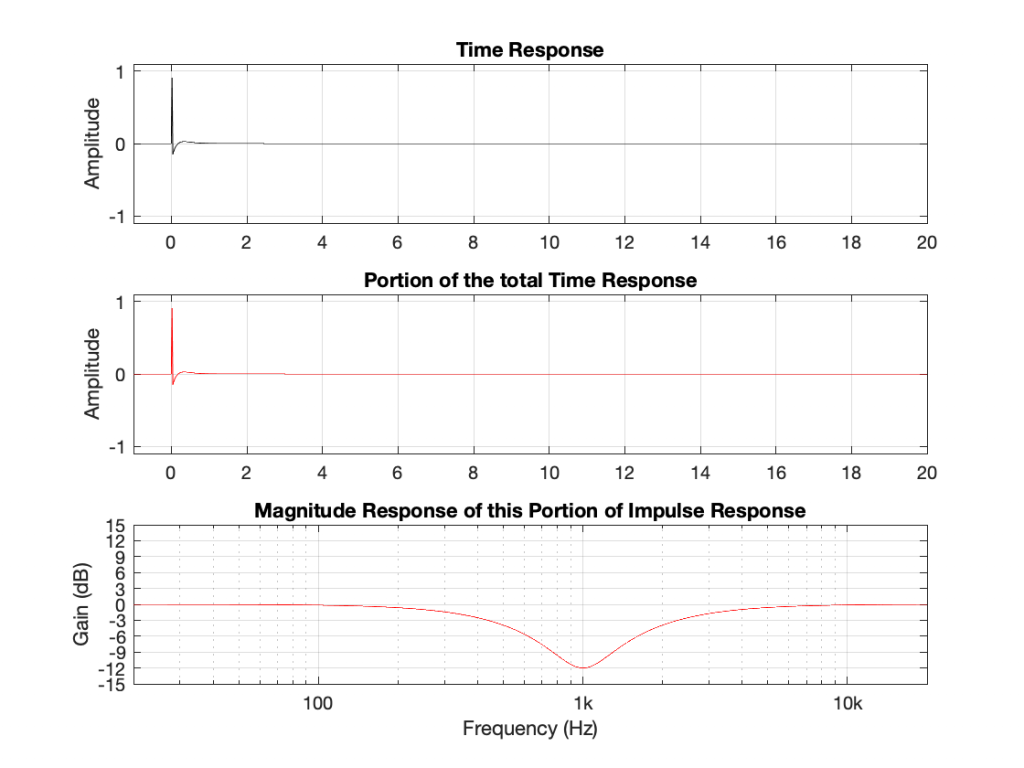
Fig 8. The time and magnitude responses of a dip filter where Fc = 1 kHz, Gain = -12 dB and Q = 2.

Notice that a dip filter also rings in time after the initial impulse, but decays much faster than the equivalent boost. (I’ll have to be a bit more careful about my use of the word “equivalent”, actually – but I’ll straighten that out at the end of the series. To be continued…)
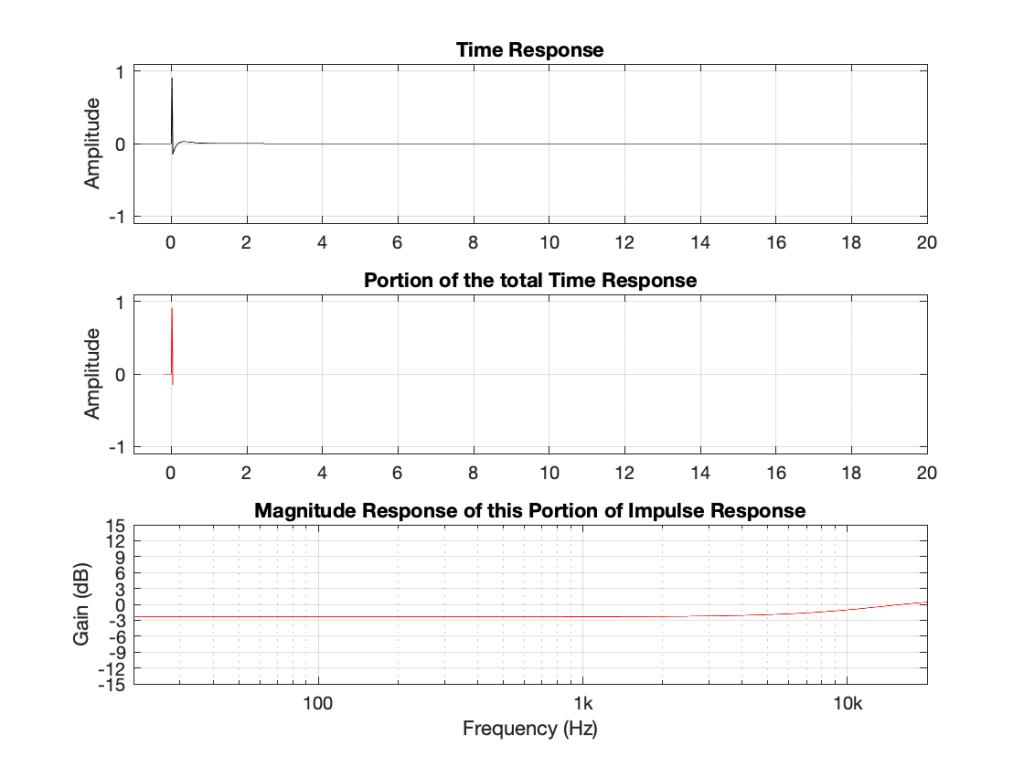
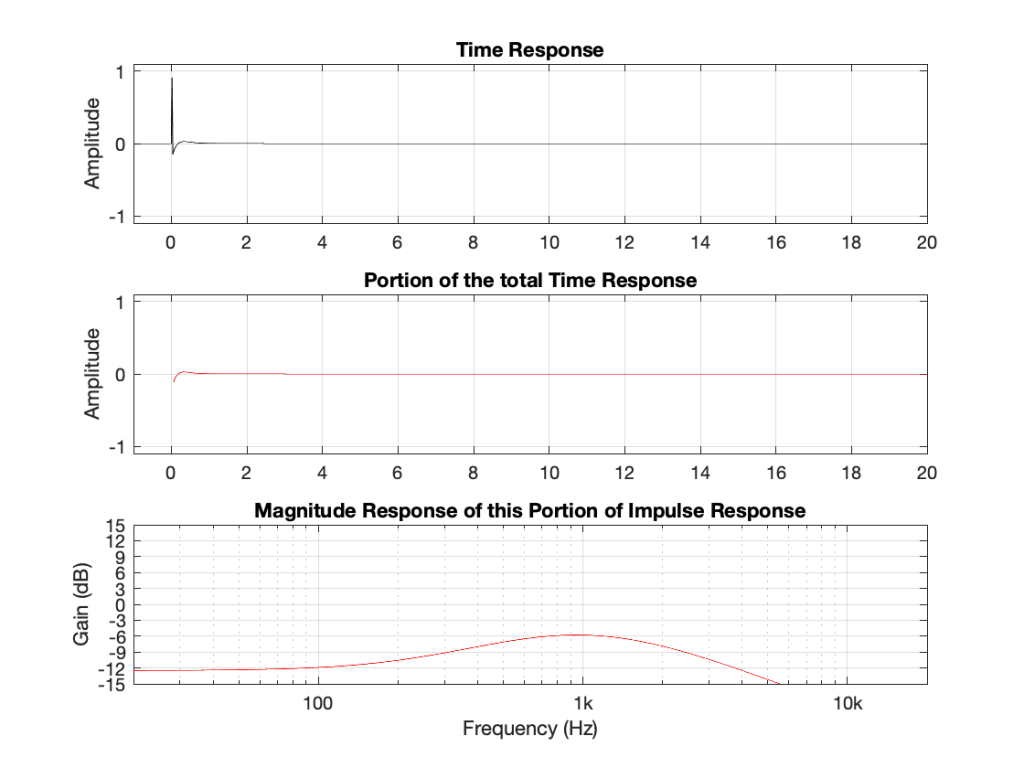
Fig. 9: Similar to the boost, the first onset of the impulse has a nearly-flat magnitude response.
Fig 10. The decay of the dip filter is also a slightly-strange-looking band-pass filter, but with an overall gain of about -6 dB.

Okay, what’s going on here? A peaking filter with a boost is a through-put plus a bandpass. A dip filter is ALSO a through-put plus a somewhat quieter (sort-of) bandpass. This doesn’t make any sense.

Actually it doesn’t make any sense because there’s a piece of information that I’m leaving out – the phase of the ringing. Notice that, with the peaking filter, the decay portion starts positive and then goes negative initially. With the dip filter, the decay starts negative and goes positive. So, the previous paragraph should have read: “A peaking filter with a boost is a through-put PLUS a bandpass. A dip filter is ALSO a through-put MINUS a somewhat quieter (sort-of) bandpass.”

The phases of the decays of the bandpass portions are opposite for the two filters. Another way to think of this is that the ringing in the dip filter cancels the energy around 1 kHz in the initial impulse, whereas the ringing in the peak filter adds to it.

However, it’s really important to note for now that both filters – the peak and the dip result in ringing in time.
Filters and Ringing: Part 1

Let’s say that, for some reason, you want to apply an equaliser to an audio signal. It doesn’t matter why you want to do this: maybe you like more bass, maybe you need more treble, maybe you’re trying to reduce the audibility of a room mode. However, one thing that you should know is that, by changing the frequency response of the system, you are also changing its time response.

Now, before we go any farther, do NOT mis-interpret that last sentence to mean that a change in the time response is a bad thing. Maybe the thing you’re trying to fix already has an issue with its time response, and sometimes you have to fight fire with fire.

Before we start talking about filters, let’s talk about what “time response” means. I often work in an especially-built listening room that has acoustical treatments that are specifically designed and implemented to result in a very controlled acoustical behaviour. I often have visitors in there, and one of the things they do to “test the acoustics” is to clap their hands once – and then listen.

On the one hand (ha ha) this is a strange thing to do, because the room is not designed to make the sound of a single hand clap performed at the listening position sound “good” (whatever that means). On the other hand, the test is not completely useless. It’s a “play-toy” version of a very useful test we use to measure a loudspeaker called an impulse response measurement. The clap is an impulsive sound (a short, loud sound) and the question is “how does the thing you’re measuring (a room or a loudspeaker, for example) respond to that impulse?”

So, let’s start by talking about the two important reasons why we use an impulse.

Time response

If a thing in a room makes a sound, then the sound radiates in all directions and starts meeting objects in its path – things like walls and furniture and you. When that happens, the surface it meets will absorb some amount of energy and reflect the rest, and this is balance of absorbed-to-reflected energy is different at different frequencies. A cat will absorb high frequencies and low frequencies will just pass by it. A large flat wall made of gypsum will reflect high frequencies and absorb whatever frequency it “wants” to vibrate at when you thump it with your fist.

The energy that is absorbed is (eventually) converted to heat: that’s lost. The reflected energy comes back into the room and heads towards another surface – which might be you as well, but probably isn’t unless you’re in a room about the size of an ancient structure known to archeologists as a “phone booth”.

At your location, you only hear the sound that reaches you. The first part of the sound that you hear “immediately” after the thing made the noise, probably travelled a path directly from the source to you. Let’s say that you’re in a large church or an aircraft hangar – the last sound that you hear as it decays to nothing might be 5 seconds (or more!) after the thing made the noise, which means that the sound travelled a total of 5 sec * 344 m/s = 1.72 km bouncing around the church before finally arriving at your position.

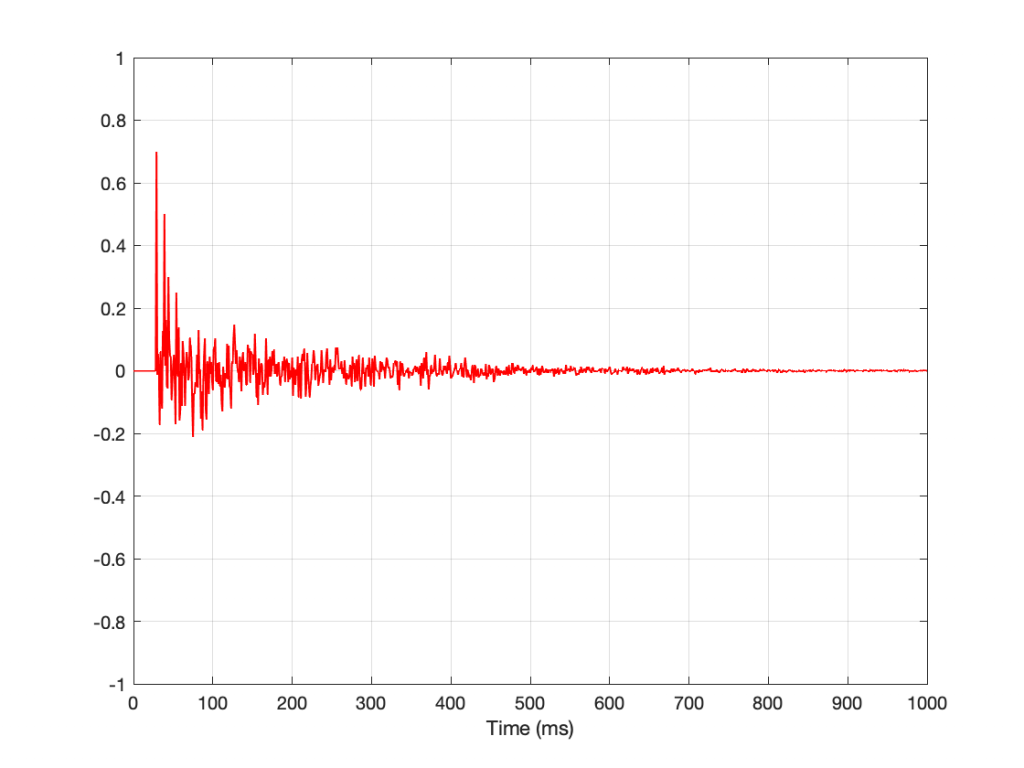
So, if I put a loudspeaker that radiates simultaneously in all directions equally at all frequencies (audio geeks call this a point source) somewhere in a room, and I put a microphone that is equally sensitive to all frequencies from all directions (audio geeks call this an omnidirectional microphone) and I send an impulse (a “click”) out of the loudspeaker and record the output of the microphone, I’ll see something like this:

Fig 1: A simulated impulse response of a room

Some things to notice about that plot shown above

  • There is some silence before the first sound starts. This is the time it takes for the sound to get from the loudspeaker to the microphone (travelling at about 344 m/s, and with an onset of about 30 ms, this means that the microphone was about 10.3 m away.
  • There are some significant spikes in the signal after the first one. These are nice, clean reflections off some surfaces like walls, the floor or the ceiling.
  • Mostly, this is a big mess, so it’s difficult to point somewhere else and say something like “that is the reflection off the coffee mug on the table over there, after the sound has already hit the ceiling and two walls on the way” for example…

So, this shows us something about how the room responds to an impulse over time. The nice (theoretical) thing is that this is a plot of what will happen to everything that comes out of the loudspeaker, over time, when captured at the microphone’s position. In other words, if you know the instantaneous sound pressure at any given moment at the output of the point-source loudspeaker, then you can go through time, multiplying that value by each value, moment by moment, in that plot to predict what will come out of the microphone. But this means that the total output of the microphone is all of the sound that came out of the loudspeaker over the 1000 ms plotted there, with each moment individually multiplied by each point on the plot – and all added together.

This may sound complicated, but think of it as a more simple example: When you’re sitting and listening to someone speak in a church, you can hear what that person just said, in addition to the reverberation (reflections) of what they said seconds ago. There is one theory that this is how harmony was invented: choirs in churches noticed that the reverb from the previous note blended nicely with the current note, and so chords were born.

Frequency Response

There is a second really good reason for using an impulse to test a system. An impulse (in theory) contains all frequencies at the same level. This is a little difficult to wrap ones head around (at least, it took me years to figure out why…) but let me try to explain.

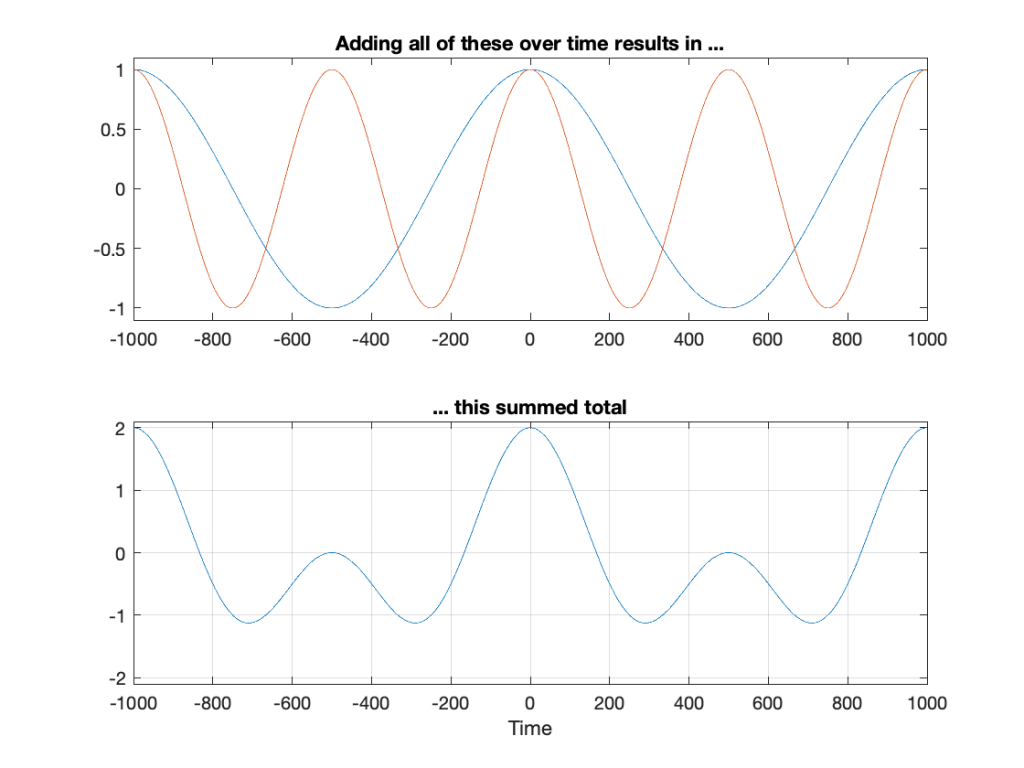
Any sound is the combination of some number of different frequencies, each with some level and some time relationship. This means that, I can start with the “ingredients” and add them together to make the sound I want. If I start with two frequencies: 1 Hz and 2 Hz and add them together, using cosine waves (a cosine wave is the same as a sine wave that starts 90º late), the result is as shown in Figure 2.

Fig 2. The top plot shows two cosine waves with frequencies of 1 Hz (blue) and 2 Hz (red). The bottom plot is the result of adding them together, point by point, over time. For example, at Time = 0 ms, you can see the result is 1+1 = 2. At Time = 500 ms, the result is 1 + -1 = 0.

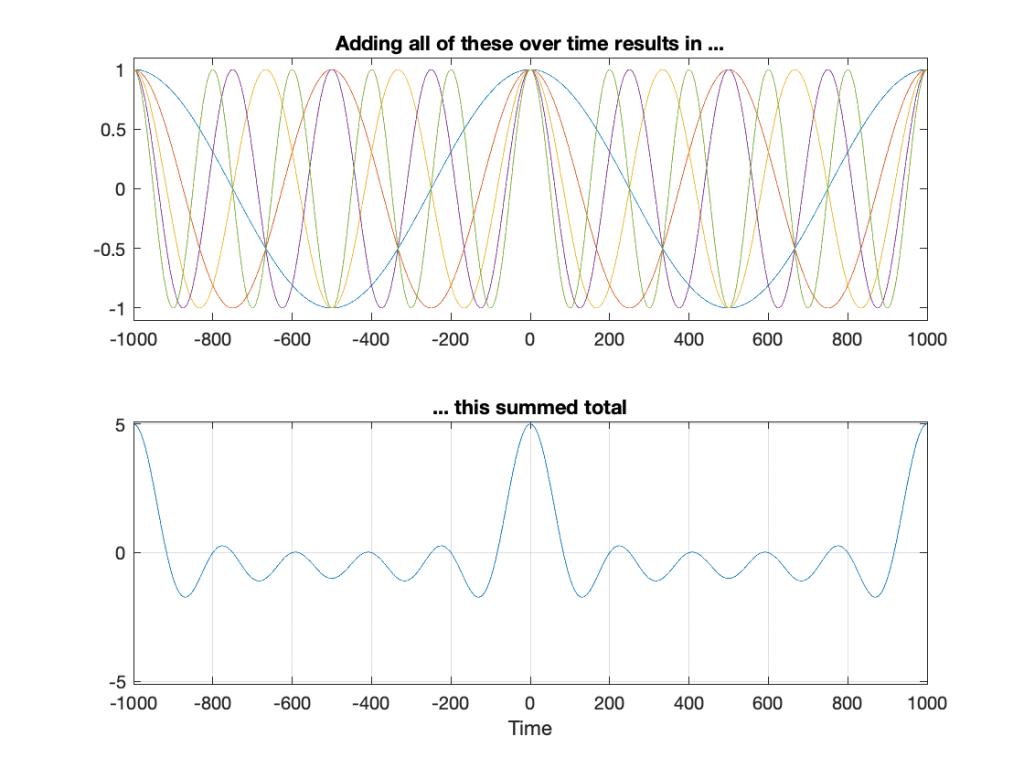
Let’s do this again, but increase the number to 5 frequencies: 1 Hz, 2 Hz, 3 Hz, 4 Hz, and 5 Hz.

Fig 3. Adding 5 frequencies results in a different total – notice, though that the peak at Time = 0 ms is 5, for example.

You may notice that the peak at Time = 0 ms is getting bigger relative to the rest of the result. However, we get the same peak values at Time = -1000 ms and Time = 1000 ms. This is because the frequencies I’m choosing are integer values: 1 Hz, 2 Hz, 3 Hz, and so on. What happens if we use frequencies in between? Say, 0.1 Hz to 10 Hz in steps of 0.1 Hz, thus making 100 cosine waves added together? Now they won’t line up nicely every second, so the result looks like Figure 4.

Fig 4. Adding 100 frequencies from 0 Hz to 10 Hz in steps of 0.1 Hz looks ugly at the top because of all of the overlapping plots. However, those overlapping plots start to cancel each other out, so we get a big peak where they all hit 1 (at Time = 0 ms) and approach 0 at all other times.

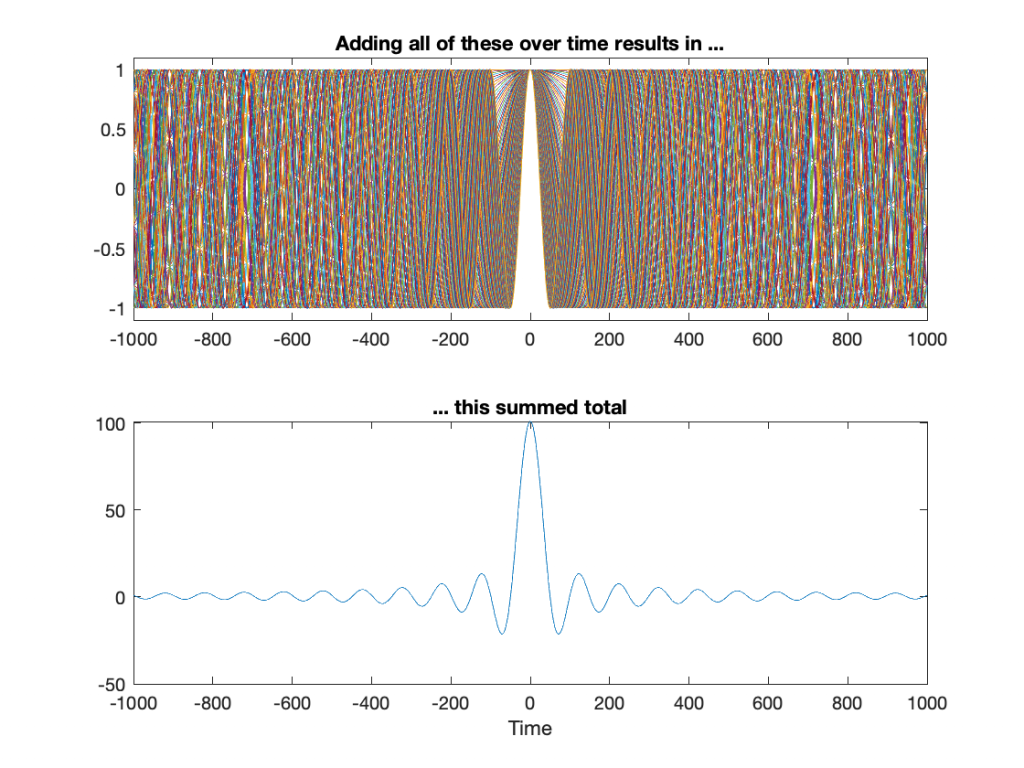
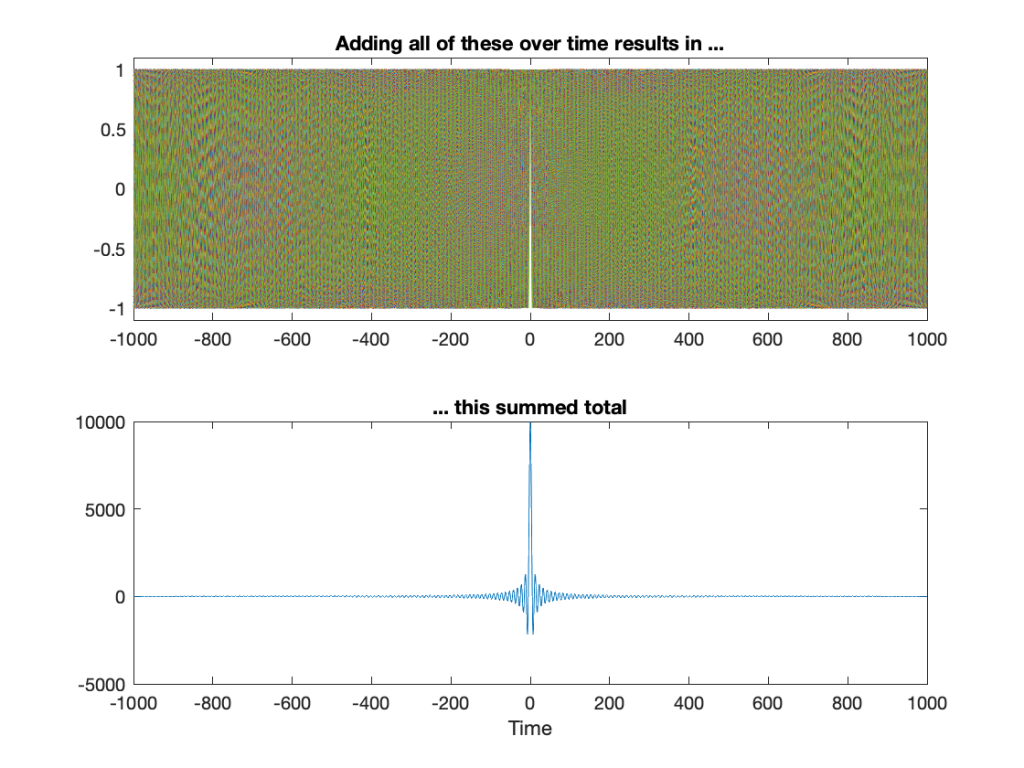
Let’s get crazy. Figure 5 shows 10,000 cosine waves with frequencies of 0 to 100 Hz in steps of 0.01 Hz.

Fig 5. Adding 10001 frequencies from 0 Hz to 100 Hz in steps of 0.01 Hz.

You may start to notice that the result of adding more and more cosine waves together at different frequencies is starting to look a lot like an impulse. It’s really loud at Time = 0 ms (whenever that is, but typically we think that it’s “now”) and it’s really quiet forever, both in the past and the future.

So, the moral of the story here is that if you click your fingers and make a “perfect” impulse, one philosophical way to think of this is that, at the beginning of time, cosine waves, all of them at different frequencies, started sounding – all of them cancelling each other until that moment when you decided to snap your fingers at Time = 0. Then they all continue until the end of time, cancelling each other out forever…

Or, another way to think of it is simply to say “an impulse contains all frequencies, each with the same amplitude”.

One small point: you may have noticed in Figure 5 that the impulse is getting big. That one added up to 10,001 – and we were just getting started. Theoretically, a real impulse is infinitely short and infinitely loud. However, you don’t want to make that sound because an infinitely loud sound will explode the universe, and that will wreck your analysis… It will at least clip your input.

Equalisation

Let’s take a simple example of an equaliser. I’ll use an EQ to apply a boost of 12 dB with a centre frequency of 1 kHz and a Q of 2. (Note that “Q” has different definitions. The one I’ll be using here is where the Q = Fc / BW, where BW is the bandwidth in Hz between the -3 dB points relative to the highest magnitude. If you want to dig deeper into this topic, you can start here.) That filter will have a magnitude response that looks like this:

Fig 6. The gain response of an equaliser using a peaking filter where Fc = 1 kHz, Gain = +12 dB, and Q = 2.

As you can see there, this means that a signal coming into that filter at 20 Hz or 20 kHz will come out at almost exactly the same level. At 1000 Hz, you’ll get 12 dB more at the output than the input. Other frequencies will have other results.

The question is: “how does the filter do that, conceptually speaking?”

That’s what we’ll look at in the next part of this series.

“High-Res” Audio: Part 13: Wrapping up

As I’ve stated a couple of times through this series, my reason for writing this stuff was not to prove that high res audio is better or worse than normal res audio (whatever that is…). My reason was to highlight some of the advantages and disadvantages associated with LPCM audio at different bit depths and sampling rates. Just as a bullet-point summary of things-to-remember/consider (with some loose grouping):

  • “High resolution audio” could mean
    • “more than 16 bits per sample”
      or
    • “a sampling rate higher than 44.1 kHz”
      or
    • both.
  • These two dimensions of the specifications have different implications on the signal

  • Doubling the sampling rate only increases your audio bandwidth by 1 octave.
    Yes, it’s twice as much information, but that’s only one octave. If you add an extra octave on top of a piano, you don’t get twice as many notes.
  • Just because you have more bits per sample doesn’t mean that you are actually getting more resolution.
    There are examples out there where a “24-bit recording” is just a 16-bit recording with 8 zeros stuck on the end.
  • Just because you have a higher sampling rate doesn’t mean that you are actually getting a recording that was done at that sampling rate.
    There are examples out there where, if you do a spectral analysis of a “high-res” recording, you’ll see the cutoff filter of the original 44.1 kHz recording.
  • Just because you have a recording done at a higher sampling rate doesn’t mean that the extra information you get is actually useful.


  • There are many cases where you want equipment that has higher specifications than your audio signal.
  • If you have a volume control after the conversion to analogue, then 93 dB of dynamic range (16 bits, TPDF dithered) might be enough – especially if you listen to music with a limited dynamic range. However, if your volume control is in the digital domain, and you have a speaker that can play loudly, then you’ll probably want more dynamic range, and therefore more bits per sample hitting the DAC.

Like I said, I’m not here to tell you that one thing is better or worse than another thing.

As I said, my intention in writing all of this is to help you to never fall into the trap of assuming that “high resolution audio” is better than “normal resolution audio” in all respects.

More is not necessarily better, sometimes, it’s not even more. Don’t fall victim to misleading advertising.

“High-Res” Audio: Part 12: Outputs

Part 1
Part 2
Part 3
Part 4
Part 5
Part 6
Part 7
Part 8a
Part 8b
Part 9
Part 10
Part 11

This series has flipped back and forth between talking about high resolution audio files & sources and the processing that happens in the equipment when you play it. For this posting, we’re going to deal exclusively with the playback side – regardless of the source content.

I work for a company that makes loudspeakers (among other things). All of the loudspeakers we make use digital signal processing instead of resistors, capacitors, and inductors because that’s the best way to do things these days…

Point 1: This means that our volume control is a gain (a multiplier) that’s applied to the digital signal.

We also make surround processors (most of our customers call them “televisions”) that take a multichannel audio input (these days, this is under the flag of “spatial audio”, but that’s just a new name on an old idea) and distribute the signals to multiple loudspeakers. Consequently, all of our loudspeakers have the same “sensitivity”. This is a measurement of how loud the output is for a given input.

Let’s take one loudspeaker model, Beolab 90, as an example. The sensitivity of this loudspeaker is set to be the same as all other Bang & Olufsen loudspeakers. Originally, this was based on an analogue signal, but has since been converted to digital.

Point 2: Specifically, if you send a 0 dB FS signal into a Beolab 90 set to maximum volume, then it will produce a little over 122 dB SPL at 1 m in a free field (theoretically).

Let’s combine points 1 and 2, with a consideration of bit depth on the audio signal.

If you have a DSP-based loudspeaker with a maximum output of 122 dB SPL, and you play a 16-bit audio signal with nothing but TPDF dither, then the noise floor caused by that dither will be 122 – 93 = 29 dB SPL which is pretty loud. Certainly loud enough for a customer to complain about the noise coming from their loudspeaker.

Now, you might say “but no one would play a CD at maximum volume on that loudspeaker” to which I say two things:

  1. I do.
    The “Banditen Galop” track from Telarc’s disc called “Ein Straussfest” has enough dynamic range that this is not dangerous. You just get very loud, but very short spikes when the gunshots happen.
  2. That’s not the point I’m trying to make anyway…

The point I’m trying to make is that, if Beolab 90 (or any other Bang & Olufsen loudspeaker) used 16-bit DACs, then the noise floor would be 29 dB SPL, regardless of the input signal’s bit depth or dynamic range.

So, the only way to ensure that the DAC (or the bit depth of the signal feeding the DAC) isn’t the source of the noise floor from the loudspeaker is to use more than 16 bits at that point in the signal flow. So, we use a 24-bit DAC, which gives us a (theoretical) noise floor of 122 – 141 = -19 dB SPL. Of course, this is just a theoretical number, since there are no DACs with a 141 dB dynamic range (not without doing some very creative cheating, but this wouldn’t be worth it, since we don’t really need 141 dB of dynamic range anyway).

So, there are many cases where a 24-bit DAC is a REALLY good idea, even though you’re only playing 16-bit recordings.

Similarly, you want the processing itself to be running at a higher resolution than your DAC, so that you can control its (the DAC’s) signal (for example, you want to create the dither in the DSP – not hope that the DAC does it for you. This is why you’ll often see digital signal processing running at floating point (typically 32-bit floating point) or fixed point with a wider bit depth than the DAC.

“High-Res” Audio: Part 11: How high can you go?

Part 1
Part 2
Part 3
Part 4
Part 5
Part 6
Part 7
Part 8a
Part 8b
Part 9
Part 10

If you you get an audiometry test done, you’ll be shown into a small room, about the size of a public bathroom stall. Someone will put a pair of headphones on you, and pass you a small handle with a button. Your instructions are to press the button if you hear a tone. Then the audiometrist will leave the room, closing the door, and you’ll suddenly realise that if there’s any noise in this room, it’s because you’re making it.

Then you hear a beep in your left ear. You press the button. You hear a quieter beep. Press. Quieter beep. Press…. …. …. Beep, press… …. …. …. Beep, press…. New frequency beep, loud again. Press… and so on.

What’s happening here is that you’re presented with a sine tone at some frequency, probably loud enough for you to hear. You press. The tone gets quieter, and you press again. Eventually, the tone is so quiet that you cannot hear it (this is normal) so you don’t press. So, the tone gets louder, and you press. Then it gets quieter again, until you can’t hear it again.

By crossing over that threshold of “can hear” and “can’t hear” a couple of times, the audiometrist finds out whether or not you got lucky… If you bottom out at the same level a couple of times in a row, then that’s your threshold of hearing at that frequency in that ear.

The frequency changes (usually by 1 octave, but sometimes less), and the whole process is repeated.

If you get a full test done, then this is probably done at 9 frequencies (250, 500, 1k, 1.5k, 2k, 3k, 4k, 6k, and 8kHz) in both ears individually – 18 tests in all.

You’ll then be given a sheet of paper, or at least shown a plot of your hearing threshold. Typically, if you have “normal” hearing (whatever that means) your thresholds will all be sitting on a horizontal line marked 0 dB. If you’re “better than normal” then you get a negative score, if you’re “worse than normal” you get a positive score.

What does this mean?

Let’s start over.

If a lot of people do this test, and we only test at 1 kHz, we’ll find out that, after the results are averaged, the group can hear the 1 kHz sine tone when the change in air pressure at the ear entrance is 20 µPa. We’re not going to talk about what this means other than to say that “sound is a change in air pressure over time, and that pressure is measured in pascals, abbreviated Pa”. Needless to say, 20 µPa is pretty quiet, since it’s the quietest sound a group of people can hear at 1 kHz when you take their average.

If you did that test at a much lower frequency, you would find out that people aren’t as good at hearing quiet sounds. In other words, at 100 Hz, the sine tone has to be louder than 20 µPa for people to hear it.

The same is true if you repeated the test at a much higher frequency – say, 10,000 Hz.

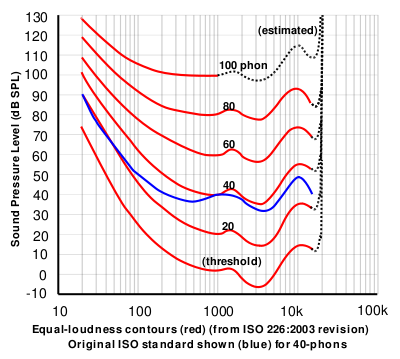
If you did this test at a lot of frequencies, then you’d find out that, on average, the threshold of hearing for a human follows the bottom red line of the plot in Figure 1, borrowed from Wikipedia.

Figure 1: The bottom red curve is the average threshold of hearing for a human being.

That bottom plot shows the threshold of hearing for different frequencies, plotted in dB SPL. Notice that, at 1 kHz, the line is at 0 dB SPL. This is because 0 dB SPL is defined to be the average threshold of hearing of a human at 1 kHz, which is 20 µPa. So, it’s not an accident…

Looking at that plot, you can see that, in order to hear a sine tone at 20 Hz, the tone has got to be more than 70 dB louder (that’s a LOT louder). So, a microphone “sees” a 73 dB SPL, 20 Hz sine tone as being louder than a 0 dB SPL, 1 kHz sine tone – but as far as you’re concerned, they’re both “the quietest sound you can hear” – therefore, they’re the same level.

If we take that threshold of hearing curve, and we play tones at those levels for those frequencies, then you should “just be able to” hear them. So, we’ll call those levels “0 dB” – since it’s the same as what is expected of you.

In other words, the piece of paper you got from the audiometrist tells you how much above or below that red threshold of hearing YOU sit.

Now, let’s back up a bit.

  1. I said that, in your test, you only went up to 8 kHz. This is because, above that (and possibly even before that) the headphones might not be trust-worthy, and even a tiny movement (say a couple of millimetres) in the position of the headphones will have a (relatively) big effect on the level at your eardrum. So, rather than get people worried about losing their hearing at 20,000 Hz (when, in fact, they were actually just wearing the headphones 1 mm too far forward), you won’t get tested.
  2. Notice how variable that threshold of hearing line is. There are big changes in level over the “audible” frequency range.
  3. Remember that the threshold of hearing curve is an AVERAGE of a lot of people. Just like no one has 2.6 children, no one has this exact response. And, if you are some freak of nature and you DO have exactly that response, you don’t for long… we all get old…
  4. Notice how that threshold of hearing curve only goes up to about 16 kHz, and above that it says “estimated”. See point #1.

Now, you should know that your ability to hear a sine tone at some frequency is defined as how your ability compares to an expectation based on an average, within a relatively small frequency band: 250 to 8 kHz.

Then you look at a textbook or you read a website that says “humans can hear from 20 Hz to 20 kHz”, which is not enough information to be either true or false… It’s like saying “humans are usually between 0 and 10 m tall” which is also sort of true, but also adequately vague to be potentially worse-than-useless information.

The truth is, unfortunately, much more complicated… However, it’s fair to say that, in order for you to just hear a sine tone at 20 kHz, it would have to be much, much louder than one at 1 kHz. In fact, if I played a 20 kHz sine tone loud enough for you to hear, measured that level, and then played a 1 kHz sine tone for you at the same level, you’d probably punch me – after you had passed out due to the pain, woken up, hunted me down, and found me… (I’d already have run away by then….)

So what?

We humans like nice, tidy, answers. “It will rain tomorrow” is preferable to “there is a 70 – 80% chance of scattered showers in the afternoon tomorrow”. We even get mad when the information is correct, but we interpret it tidily… For example, we’ll complain about getting rained on in the middle of our hike, when there was only a 10% chance of rain. On the other hand, if there was a 10% chance of winning 1 Million dollars in the lottery, we’d all buy a ticket.

Anyways, once-upon-a-time, when the committee for inventing the compact disc was holding meetings, they said “what should the sampling rate be?” and someone said “at least 40 kHz, because we can hear up to 20 kHz”. (The reason it’s 44100 is related to the fact that the bits were stored as black and white stripes on video tape, and NTSC and PAL come close to meeting each other close to that number, when you look at the numbers of lines per field and frames per second.)

Of course, like any first-generation thing, digital recording equipment wasn’t very good at the start (back around 1980 or so) – so the first DDD recordings that were released on CD sounded… well…. weird. There was quantisation distortion because they hadn’t figured out dither yet, only 12 or 13 of the bit values were working properly on the ADC’s, the anti-aliasing filters were implemented as analogue circuits, so they let some stuff through that aliased, and they rang (“sang along”) with the signal at a high frequency… All of that added up to “weird” – possibly even “bad”. Then, people who had good equipment (high-end turntables or, even better, 1/4″ tape running at 30 ips) listened to this new format, decided it was bad, and that was that.

Some of them asked “why is is bad?” and one answer they came up with was the band limiting… If the system can’t capture or store or play materials above 20 kHz, then it’s useless… Right? Maybe…

Then, instruments were put in front of measurement microphones and spectra were measured – and the proof was in. Trumpets with harmon (wah-wah) mutes, when pointing directly at the microphone, contain harmonics as high as 50 kHz! This must explain why CDs sound bad! Right? Maybe…

Then Rupert Neve did a demo at an AES (Audio Engineering Society) convention where he played people two tones. Both were at 7 kHz, but one was a sine wave and the other was a square wave (at some level). The question was: have a listen and tell me which is which. The results were the same as if everyone was just guessing. (Remember that, in order to make a square wave, you need to add odd harmonics – so the lowest-frequency content difference between a 7 kHz sine wave and a 7 kHz square wave is at 21 kHz.) Proof that we don’t need to go above 20 kHz, right? Maybe…

Some years ago, I took some “high resolution” audio files and measured their spectral content. One particularly interesting result is shown in Figures 2, below.

Figure 2: The spectral content of a 96/24 “high resolution” audio file I bought.

Look at that spike in the top end – around 20 kHz. What musical instrument makes that sound? The answer is “no musical instrument makes that sound – at least none of the baroque instruments in that recording make that sound. As I wrote back in 2014:

 If you’re wondering what it might be, I asked a bunch of smart friends, and the best explanation we can come up with is that it’s noise from a switched-mode power supply that is somehow bleeding into the recording. HOW it’s bleeding into the recording is a potentially interesting question for recording engineers. One possibility is that one of the musicians was charging up a phone in the room where the microphones were – and the mic’s just picked up the noise. Another possibility is that the power supply noise is bleeding electrically into the recording chain – maybe it’s a computer power supply or the sound card and the manufacturer hasn’t thought about isolating this high frequency noise from the audio path. Or, maybe it’s something else.

Interestingly, this is a conflict of two engineers. The designer of the power supply (assuming that’s what it is…) said “I’ll put the switching frequency above 20 kHz so that no one will hear it” and the recording engineer said “I’ll record this at 96 kHz so that people can get the content they’re missing…” The problem is that the content you’re missing is something you don’t want…

Similarly, if you listen to Eric Clapton’s “Unplugged” album with headphones or loudspeakers that have a low-enough low-frequency range, you’ll hear a loud thump, thump, thump going along with the music. This is the sound of someone tapping their foot on a temporary stage floor, shaking a vocal microphone. In my not-very-humble opinion, that should never have made it out to the public release. However, my guess is that the speakers it was mastered on didn’t go low enough… (OR, it was an artistic decision, and I would have done it differently.) Assuming that I’m right, then this is a second example where a “better” system sounds “worse”.

Of course, through all of this, I have assumed that your loudspeakers or headphones can produce the signals that we’re talking about in the direction that you’re sitting in, and that those signals are not being masked by other sounds in the room (like phone chargers singing…) However, to complicate things with reality would just be too far to go today…

Conclusions?

I don’t have any, but I have some questions and (as usual) some opinions…

  • Does a harmon mute on a trumpet produce energy at 50 kHz, if you’re sitting right in front of it?
    Yes.
  • Do you want to sit right in front of a trumpet with a harmon mute?
    Debatable.
  • Can a high-res audio recording include the sound of a phone charger?
    Yes.
  • Do you want to have an expensive recording of a baroque ensemble with obligato phone charger?
    Probably not – the charger is not in Buxtehude’s original score as far as I can see.
  • Can you hear the difference between a 7 kHz sine and a 7 kHz square wave?
    Depends on the speaker / headphone, the listening position, the background noise level, and whether or not you were out clubbing last night. Heads or tails?
  • Will you feel better by knowing that your file contains “audio” content above 20 kHz? Probably.
    Placebos have been known to work bigger miracles than this. (But don’t forget the stuff I said about sampling rate converters earlier…)

“High-Res” Audio: Part 4 – Know your limits

Part 1
Part 2
Part 3

If you’ve read the three introductory parts of this series, linked above; and if you’re still awake, then we are ready to start putting things together and jumping to incorrect conclusions…

Let’s say that you’ve been hired to specify a digital audio system for some reason (we’ll assume that it’s an LPCM system – nothing exotic). Using the information I’ve told you so far, you can make two decisions in your specification:

You select a bit depth to be enough to give you the dynamic range you desire. In this case, “dynamic range” means the “distance” in level between the loudest sound you can record / store / transmit (I isn’t say what the “digital audio system” was going to be used for) and the inherent noise floor of the system. If you’re recording the background noise on an airplane while it’s in flight, you don’t need a big dynamic range, because it’s always loud, and never changes. However, if you’re recording a Japanese Taiko Drummer group, you’ll need a huge usable dynamic range because the loud parts of the performance are a LOT louder than the quietest parts.

As we saw in Part 3, an LPCM digital audio system cannot record any audio that has a frequency higher than 1/2 the sampling rate. So, you select a sampling rate that is at least 2x the highest frequency you’re interested in. For example, if you believe the books that say you can hear from 20 Hz to 20,000 Hz, then you might decide that your sampling rate has to be at least 40,000 Hz. On the other hand, if you’re making a subwoofer that you know will never be fed a signal above 120 Hz, then you don’t need a sampling rate higher than 240 Hz.

Don’t get angry yet. I’m just keeping these numbers simple to make the math easy. Later on, I’ll explain why what I just said might not be correct.

Mistake #1

I just jumped to at least three conclusions (probably more) that are going to haunt me.

The first was that my “digital audio system” was something like the following:

Figure 1

As you can see there, I took an analogue audio signal, converted it to digital, and then converted it back to analogue. Maybe I transmitted it or stored it in the part that says “digital audio”.

However, the important, and very probably incorrect assumption here is that I did nothing to the signal. No volume control, no bass and treble adjustments… nothing.

Mistake #2

We assumed above that we can define the system’s dynamic range based on the dynamic range of the audio signal itself. However, this makes the assumption that the noise floor of the digital system and the noise floor of your audio signal are identical, which is probably not true. As we saw in Part 2, the noise generated by TPDF dither is white – it has the same probability of having a given amount of energy per Hertz. Since we hear sound logarithmically (meaning that, to us, octaves are equal widths. Equal spacings in Hz are not.) This means that the noise sound “bright” to us – because there’s just as much energy in the top octave (say, 10 kHz to 20 kHz, if you believe the books) as there is in all other frequencies combined from 0 Hz up to 10 kHz.

If, however, the noise floor in your concert hall where the taiko drummers are playing is caused by the air conditioning system, then this noise will be a lot louder in the low frequencies than the the highs – which is not the same.

Therefore it’s too simplistic to say “the noise floor of the digital system” and the “noise floor of the signal” – since these two noise floors are different. (As Steven Wright said: “It doesn’t matter what temperature the room is, it’s always room temperature.”)

Mistake #3

As we’ll see later, if you’re going to do anything to the signal while it’s in the “digital domain”, then you need to take that into consideration when you’re deciding on your sampling rate. It’s not enough to say “useful audio bandwidth times 2” because there are some side effects that need to be remembered…

However, counter-intuitively, it could be that, in order to improve your system, you’ll want to make the sampling rate LOWER instead of HIGHER – so this is not a simple case of “more is better”.

We’ll get to that topic later. For now, I’ll leave you in suspense.

Some details

One thing we saw in Part 3 was that, if we have an audio signal with energy at a frequency higher than 1/2 the sampling rate, and if that signal gets into the analogue-to-digital converter (ADC), then the output of the ADC will contain an error. We’ll get out energy at frequencies that were not in the original, due to the effect called “aliasing“.

Once that’s in the digital audio signal, there’s no removing it, so we need to make sure that the too-high-frequency signals don’t get into the ADC’s input in the first place. This is done using a low-pass filter that (in theory) removes all energy in the signal above the Nyquist frequency (which is equal to 1/2 the sampling rate). Since that low-pass filter prevents aliasing, we call it an anti-aliasing filter. Normally, these days, that antialiasing filter is built into the ADC itself.

As we also saw in Part 3, the digital-to-analogue converter (DAC) has to smooth out the digital signal to convert it from a “staircase” wave to a smoother one. That’s also done with a low-pass filter that eliminates all the harmonics that would be required to make the staircase have sharp corners. Since this is done to re-construct the analogue signal, it’s called a “reconstruction filter“.

This means that, if we pull apart some of the components in the signal chain I showed in Figure 1, it really looks more like this:

Figure 2.

On to Part 5.

What Use are Watts?

#83 in a series of articles about the technology behind Bang & Olufsen loudspeakers

Imagine water coming out of a garden hose, filling up a watering can (it’s nice outside, so this is the first analogy that comes to mind…). The water is pushed out of the hose by the pressure of the water behind it. The higher the pressure, the more water will come out, and the faster the watering can will fill.

If you want to reduce the amount of water coming out of the hose, you can squeeze it, restricting the flow by making a resistance that reduces the water pressure. The higher the resistance of the restriction to the flow, the less water comes out, and the slower the watering can fills up.

Electricity works in a similar fashion. There is an electrical equivalent of the “pressure”, which is called Electromotive Force or EMV, measured in Volts (which is why most people call it “Voltage” instead of its real name). The “flow” – the quantity of electrons that are flowing through the wire – is the current, measured in Amperes or Amps. A thing that restricts the flow of the electrons is called a resistor, since it resists the current. A resistor can be a thing that does nothing except restrict the current for some reason. It could also be something useful. A toaster, for example, is just a resistor as far as the power company is concerned. So is a computer, your house, or an entire city.

So, if we measure the current coming through a wire, and we want to increase it, we can increase the voltage (the electrical pressure) or we can reduce the resistance. These three are locked together. For example, if you know the voltage and the resistance, you can calculate the current. Or, if you know the current and the resistance, you can calculate the voltage. This is done with a very simple equation known as Ohm’s law:

V = I*R

Where V is the Voltage in Volts, I is the current in Amperes, and R is the resistance in Ohms.

For example, if you have a toaster plugged into a wall socket that is delivering 230 V, and you measure 2 Amperes of current going through it, then :

R = V / I

R = 230 / 4

R = 57.5 Ohms

However, to be honest, I don’t really care what the resistance of my toaster is. What concerns me most is how much I have to pay the power company every time I make toast. How is this calculated? Well, the power company promises to always give me 230 V at my disposal in the wall socket. The amount of current that I use is up to me. If I plug in a big resistance (like an LED lamp) then I don’t use much current. If I plug in a small resistance (say, to charge up the battery in the electric car) then I use lots. What they’re NOT doing is charging me for the current – although it does enter into another equation. The power company is charging me for the amount of Power that I’m using – because they’re charging me for the amount of work that they have to do to generate it for me.

When I use a toaster, it’s converting electrical energy into heat. The amount of heat that it generates is dependent on the voltage (the electrical pressure) and the current going through it. This can be calculated using another simple equation knowns as “Watt’s Law”:

P = V * I

So, let’s say that I plug my toaster into a 230 V outlet, and, because it is a 115 Ohm resistor, 2 Amperes goes through it. In this case, then the amount of Power it’s consuming is

P = 230 * 4

P = 920 Watts

If I’m going to be a little specific, then I should say that the Power (in Watts) is a measure of how much energy I’m transferring per second – so there’s an aspect of time here that I’m ignoring, but this won’t be important until the end of this posting.

Also, if I’m going to bring this back to the power company’s bill that they send me at the end of the month, it will be not only based on how much power I used (in Watts), but how long I used it for (in hours). So, if I make toast for 1 minute, then I used 920 Watts for 1/60th of an hour, therefore I have to pay for

920 / 60 = 15.33 Watt hours

Normally, of course, I do more than make toast once a month. In fact, I use a LOT more, so it’s measured in thousands of Watt hours or “kilowatt hours”.

For example, if I pull into the driveway with an almost-flat battery in our car, and I plug it into the special outlet we have for charging it to charge, I know that it’s using about 26 Amperes and the outlet is fixed at 380 V. This means that I’m using 10,000 Watts, and it will therefore take about 6.4 hours to charge the car (because it has a 64,000 Wh or 64 kWh battery). This means, at the end of the month, I’ll have to pay for those 64 kWh that I used to charge up the car.

So what? (So watt?)

When you play music in a loudspeaker driver, the amplifier “sees” the driver as a resistor.* Let’s say, for the purposes of this discussion, that the driver has a resistance of 8 Ohms. (It doesn’t, but today, we’ll pretend.) To play the music, the amplifier sends a signal that, on an oscilloscope, looks like the signal that came out of a microphone once-upon-a-time (yes – I’m oversimplifying). That signal that you’re looking at is the VOLTAGE that the amplifier is creating to make the signal. Since the loudspeaker driver has some resistance, we can therefore calculate the current that it “asks” the amplifier to deliver. As the voltage goes up, the current goes up, because the resistance stays the same (yes – I’m oversimplifying).

Now, let’s think about this: The amplifier is generating a voltage, and therefore it has to deliver a current. If I multiply those two things together, I can get the power: P = V*I. Simple, right?

Well, yes…. but remember that thing I said above about how power, in Watts, has an element of time. One watt is a measure of energy that is transferred into a thing (in our case, a loudspeaker driver) in one second. And this is where things get complicated, and increasingly irrelevant.

The problem is that power, measured in watts, has an underlying assumption that the consumption is constant. Turn on an old-fashioned light bulb or start making toast, and the power that you consume over time will be the same. However, when you’re playing Stravinsky on a loudspeaker, the voltage and the current are going up and down all the time – if they weren’t, you’d be listening to a sine wave, which is boring.

So, although it’s easy to use Watts to specify a the amount of energy an amplifier can deliver or a loudspeaker driver’s capabilities, it’s not really terribly useful. Instead, it’s much more useful to know how many volts the amplifier can deliver, and how many amperes it can push out before it can’t deliver more (and therefore distorts). However, although you know the maximum voltage and the maximum current, this is not necessarily the maximum power, since it might only be able to deliver those maxima for a VERY short period of time.

For example, if you measure the peak voltage and the peak current that comes out of all of the amplifiers in a Beolab 90 for less than 5 thousandths of a second (5 milliseconds), the you’ll get to a crazy number like 18,000 Watts. However, after about 5 ms, that number drops very rapidly. It can deliver the peak, but it can’t deliver it continuously (if it could, you’d trip a circuit breaker). (Similarly, you can drive a nail into wood by hitting it with a hammer – but you can’t push it in like a thumbtack. The amount of force you can deliver in a short peak is much higher than the amount you can deliver continuously.)

This is why, when we are specifying a power amplifier that we’ll need for a new loudspeaker at the beginning of the development process, we specify it in Peak Voltage and Peak Current (also the continuous values as well, of course) – but not Watts. Yes, you can use one to calculate the other, but consider this:

Amplifier #1: 1000 W amplifier, capable of delivering 10 V and 100 Amps

Amplifier #2: 1000 W amplifier, capable of delivering 100 V and 10 Amps

These are two VERY different things – so just saying a “1000 W amplifier” is not nearly enough information to be useful to anyone for anything. However, since advertisers have a long history of talking about a power amplifier’s capabilities in terms of watts, the tradition continues, regardless of its irrelevance. On the other hand, if you’re buying a toaster, the power consumption is a great thing to know…

* I’m pretending for this posting that a loudspeaker driver acts as a resistor to keep things simple. It doesn’t – but I’m not going to talk about phase or impedance today.

P.S. Yes, I cut MANY corners and oversimplified a LOT of issues in this posting – I know. Don’t send me hate mail because I didn’t mention reactance or crest factor…

What’s a woofer?

#82 in a series of articles about the technology behind Bang & Olufsen loudspeakers

Occasionally, a question that comes into the customer communications department to Bang & Olufsen from a dealer or a customer eventually finds its way into my inbox.

This week, the question was about nomenclature. Why is it that, on some loudspeakers, for example, we say there is a tweeter, mid-range, and woofer, whereas on other loudspeakers we say that we’re using a “full range” driver instead? What’s the difference? (Folded into the same question was another about amplifier power, but I’ll take that one in another posting.)

So, what IS the difference? There are three different ways to answer this question.

Answer #1: It’s how you use it.

My Honda Civic, the motorcycle that passed me on the highway this morning, and an F1 car all have a gear in the gearbox that’s labelled “3”. However, the gear ratio of those three examples of “third gear” are all different. In other words, if you showed a mechanic the gear ratio of one of those gearbox settings without knowing anything else, they wouldn’t be able to tell you “ah! that’s third gear…”

So, in this example, “third gear” is called “third” only because it’s the one between “second” and “fourth”. There is nothing physical about it that makes it “third”. If that were the case then my car wouldn’t have a first gear, because some farm tractor out there in the world would have a gear with a lower ratio – and an F1 car would start at gear 100 or so… And that wouldn’t make sense.

Similarly, we use the words “tweeter”, “midrange”, “woofer”, “subwoofer”, and “full range” to indicate the frequency range that that particular driver is looking after in this particular device. My laptop has a 1″ “woofer” – which only means that it’s the driver that’s taking care of the low frequencies that come out of my laptop.

So, using this explanation, the Beolab 90 webpage says that it has midranges and tweeters and no “full range” drivers because the midrange drivers look after the midrange frequencies, and the tweeters look after the high frequencies. However, the Beolab 28’s webpage says that it has a tweeter and full range drivers, but no midranges. This is because the drivers that play the midrange frequencies in the Beolab 28 also play some of the high-frequency content as part of the Beam Width control. Since they’re doing “double duty”, they get a different name.

Answer #2: Excruciating minutiae

The description I gave above isn’t really an adequate answer. For example, I said that my laptop has a 1″ “woofer”. Beolab 90 has a 1″ “tweeter” – but these two drivers are not designed the same way. Beolab 90’s tweeter is specifically designed to be used to produce high frequencies. One consequence of this is that the total mass of the moving parts (the diaphragm and voice coil, amongst other things) is as low as possible, so that it’s easy to move. This means that it can produce high frequency signals without having to use a lot of electrical power to push it back and forth.

However, the 1″ “woofer” in my laptop is designed differently. It probably has a much higher total mass for the moving parts. This means that its resonant frequency (the frequency that it would “ring” at if you hit it like a drum head) is much lower. Therefore it “wants” to move easily at a lower frequency than a tweeter would.

For example, if you put a child on a swing and you give them a push, they’ll swing back and forth at some frequency. If the child wanted to swing SLOWER (at a lower frequency), you could

  • move to a swing with longer ropes so this happens naturally, or
  • you can hold on to the ropes and use your muscles to control the rate of swinging instead.

The smarter thing to do is the first choice, that way you can keep sipping your coffee instead of getting a workout.

So, a 1″ woofer and a 1″ tweeter are not really the same thing.

Answer #3: Compromise

We live in a world that has been convinced by advertisers that “compromise” is a bad thing – but it’s not. Someone who does never accepts to compromise is destined to live a very lonely life. When designing a loudspeaker, one of the things to consider is what, exactly, each component will be asked to do, and choose the appropriate components accordingly.

If we’re going to be really pedantic – there’s really no such thing as a tweeter, woofer, or anything else with those kinds of names. Any loudspeaker driver can produce sound at any frequency. The only difference between them is the relative ease with which the driver plays a signal at a given frequency. You can get 20 Hz to come out of a “tweeter” – it will just be naturally a LOT quieter than the signals at around 5 kHz. Similarly, a woofer can play signals at 20 kHz, but it will be a lot quieter and/or take a lot more power than signals at 50 Hz.

What this means is that, when you make an active loudspeaker, the response (the relative levels of signals at different frequencies) is really a result of the filters in the digital signal processing and the control from the amplifier (ignoring the realities of heat and time…). If we want more or less level at 2 kHz from a loudspeaker driver, we “just” change the filter in the signal processing and use the amplifier to do the work (the same as the example above where you were using your muscle power to control the frequency of the child on the swing).

However, there are examples where we know that a driver will be primarily used for one frequency band, but actually be extending into another. The side-facing drivers on Beolab 28 are a good example of this. They’re primarily being used to control the beam width in the midrange, but they’re also helping to control the beam width in the high frequencies. Since, they’re doing double-duty in two frequency ranges, they can’t really be called “midranges” or “tweeters” – they’d be more accurately called “midranges that also play as quiet tweeters”. (They don’t have to play high frequencies loudly, since this is “only” to control the beam width of the front tweeter.) However, “midranges that also play as quiet tweeters” is just too much information for a simple datasheet – so “full range” will do as a compromise.

P.S.

I’ve got some extra things to add here…

Firstly, it has become common over the past couple of years to call “woofers” “subwoofers” instead. I don’t know why this happened – but I suspect that it’s merely the result of people who write advertising copy using a word they’ve heard before without really knowing what it means. Personally, I think that it’s funny to see a laptop specified to have a “1” subwoofer”. Maybe we should make the word “subtweeter” popular instead.

Secondly, personally, I believe that a “subwoofer” is a thing that looks after the frequency range below a “woofer”. I remember a conversation I had at an AES convention once (I think it was with Günther Theile and Tomlinson Holman) where we all agreed that a “subwoofer” should look after the frequency range up to 40 Hz, which is where a decent woofer should take over.

Lastly, if you find an audio magazine from the 1970s, you’ll see that a three-way loudspeaker had a “tweeter”, “squawker”, and “woofer”. Sometime between then and now, “squawker” was replaced with “midrange” – but I wonder why the other two didn’t change to “highrange” and “lowrange” (although neither of these would be correct, since all three drivers in a three-way system have limited frequency ranges).

Telefunken Lido: Repair (Day 6)

Day 5’s work can be seen here.

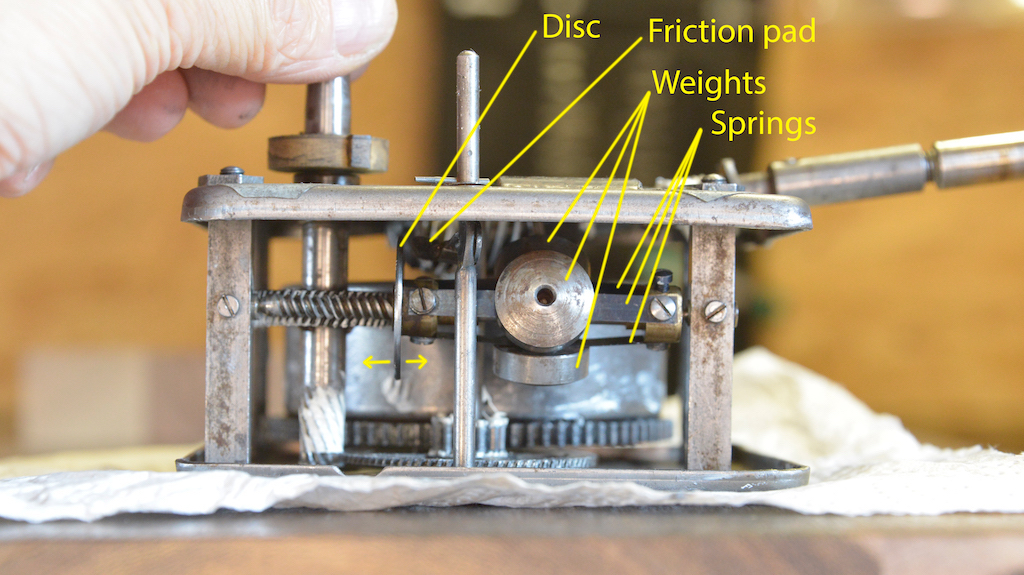
So, it was obvious that the speed regulation wasn’t working properly at the end of Day 5. So, last night was spent digging for information on how centrifugal speed governors work and I came across this excellent explanation.

So, my theory was that the disc was seized on the axle and not moving correctly with the rotational speed. This means that everything came apart again, and the axle had to come out.

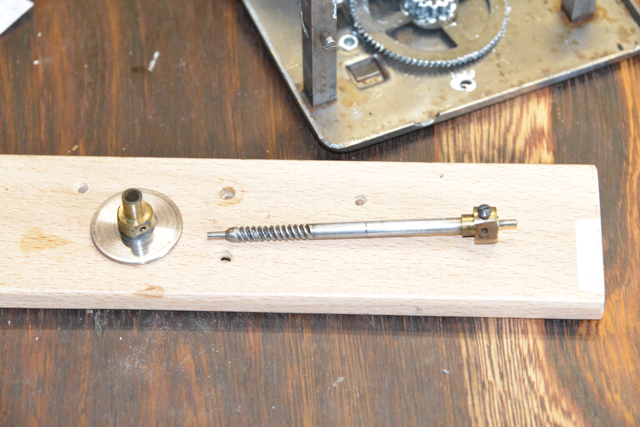
In theory, as the governor spins faster, the three weights get pulled out. This in turn should pull the disc in to rub against the friction pad. When it came out of the motor, the disc was immovable – it was stuck to the axle as I guessed. So, the three springs+weights were removed from the axle and, after a lot of WD-40 and a little repeated gentle “persuasion”, I got to here:

This is after I polished the rust off the axle with sandpaper, starting at 400 and working up to 3200 (lubricated with more WD-40). I was sanding along the length of the axle, since that’s the direction of movement of the disc.

Then it was “just” a matter of putting it all back together again… However, before I put it back in the case, I checked that the governor was working, which you can see below. Notice how the disc moves sideways to meet the friction pad, keeping things at a constant speed.

Then it was just a matter of putting everything back together again… And I have a working Telefunken Lido for those Sunday afternoon garden parties!