I mentioned in this posting that lately I’ve been doing some measurements of a DUT that:
- required a frequency analysis with a very big dynamic range
- … which meant that I was testing it using a sine tone with a frequency that was exactly the same as an FFT bin’s frequency centre
- … and the sine tone had to be sent through the device by playing a standard audio file (wav and/or FLAC)
So, I did this, but I saw some weirdness that I didn’t expect down in the noise floor of the FFT output. Whenever I’m testing something and I see something weird, I start working my way back through the audio chain to verify that the weirdness is coming from the thing that I’m testing, and not from my test system itself.
So, the first step was to do of an FFT of both the .wav and the .flac files that I was sending through the DUT. The results of this test looked something like Figure 1.
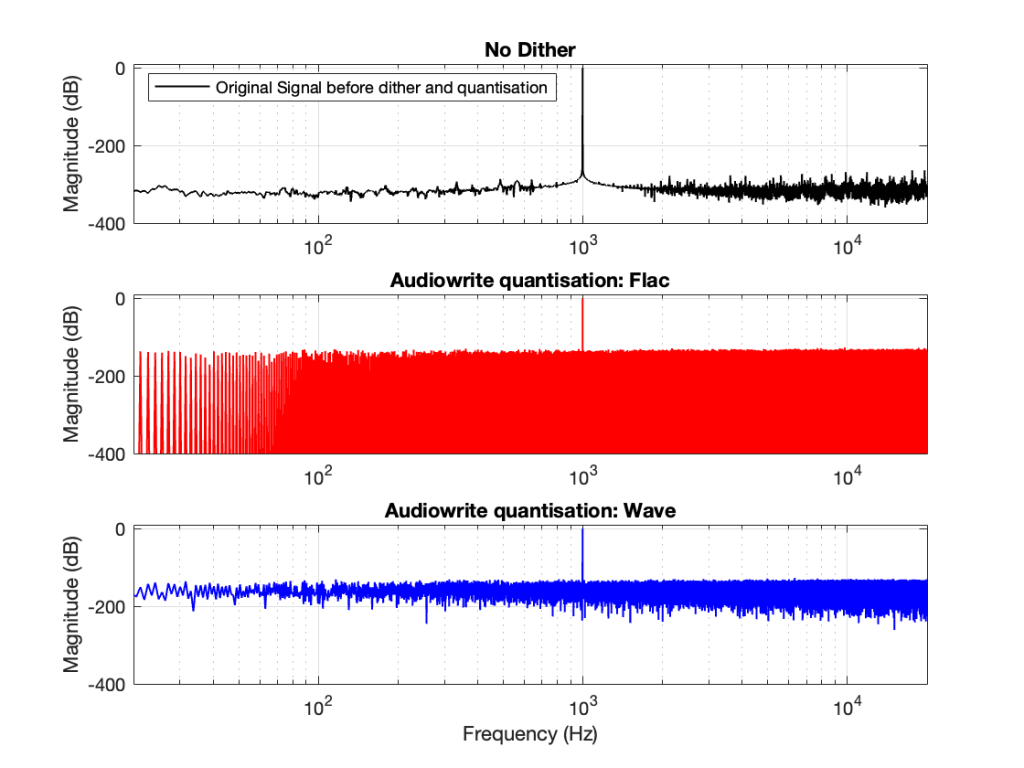
Before I go further, let’s clarify exactly what I did to generate those three plots.
- Using Matlab, I made a sine wave with a frequency identical to an FFT bin that was a close as possible to 997 Hz as I could get with a 65,536-point FFT at 48 kHz. (See this posting for more information about this.)
- I exported the signal using Matlab’s “audiowrite” function, both as a 24-bit wav and a 24-bit FLAC.
- I imported the two files back into Matlab
- I ran an FFT on the original, and the two imported files
I would not expect the bottom two plots to be as “good” as the top plot, since they’ve been reduced to a 24-bit fixed point version of the original floating-point signal. However, there are two things to notice in Figure 1.
- The most important thing is that the FLAC and WAVE imports produce different results. This is weird.
- The less-important (but more interesting, later…) thing is that, for the FLAC import, every odd-numbered FFT bin is -∞ dB, which means that there is absolutely NO energy at those frequencies.
First things first
Let’s address that first issue first. The FFTs show us that the signals coming back from the .wav and .flac import are different. But I’m interested in (1) how they’re different and (2) why they’re different.
Let’s try to answer the first question first. I made a linear ramp that had the same number of samples as the number of quantisation values and had a range of -1 to 1 (just like my sine wave…). So, to test a 16-bit export, I made a ramp that was 216 = 65,536 samples long (shown in the top plot in Figure 2). To test a 24-bit export, the ramp was 224 samples long.
In theory, if I export this ramp to a file type with the matching number of bits, then each sample should quantise to the next quantisation level from the bottom to the top. I then exported this ramp out to .wav and .flac, imported it again, and looked at the result, which is shown in Figure 2.
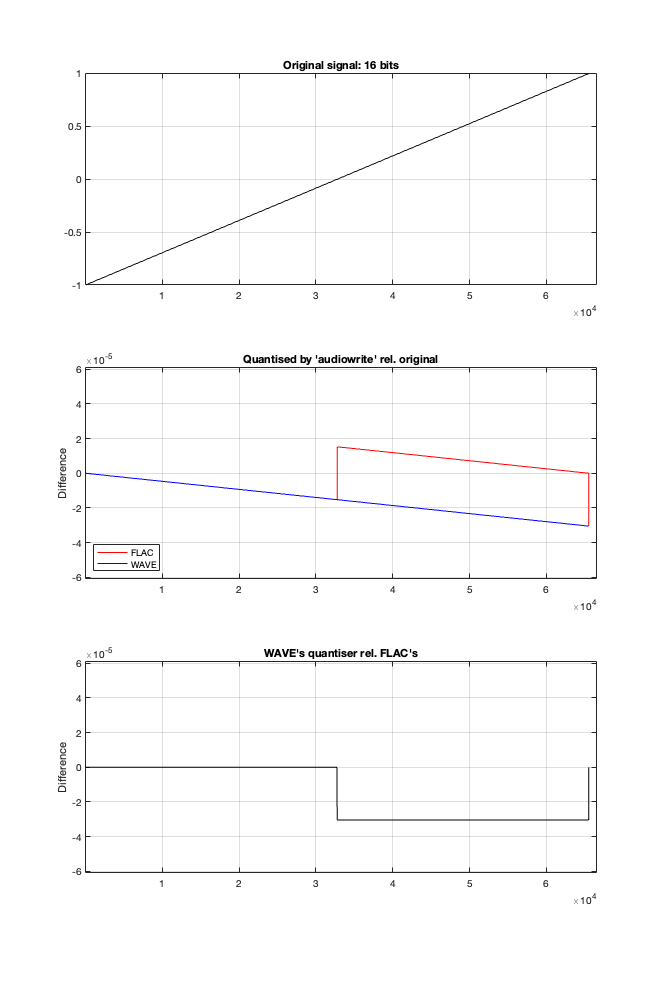
If I subtract the results of the imported files from the original, I get the result shown in the middle plot in Figure 2. I would NOT expect either the .wav or the .flac to be identical to the original, since information is lost in the export to a 16- or 24-bit fixed point LPCM format. However, I WOULD expect the .wav and .flac to be the same, which they obviously aren’t.
As can be seen in the bottom plot in Figure 2, there is a 1-quantisation level difference between the .wav and .flac files for signal values higher than 0.
Now the question is whether this difference is inherent in the file format, or if something else is going on. To test this, I did the same test on the 997-ish Hz sine wave (again) without dither, but with my own quantisation (using the code shown in this post). The result of this test is shown in Figure 3.
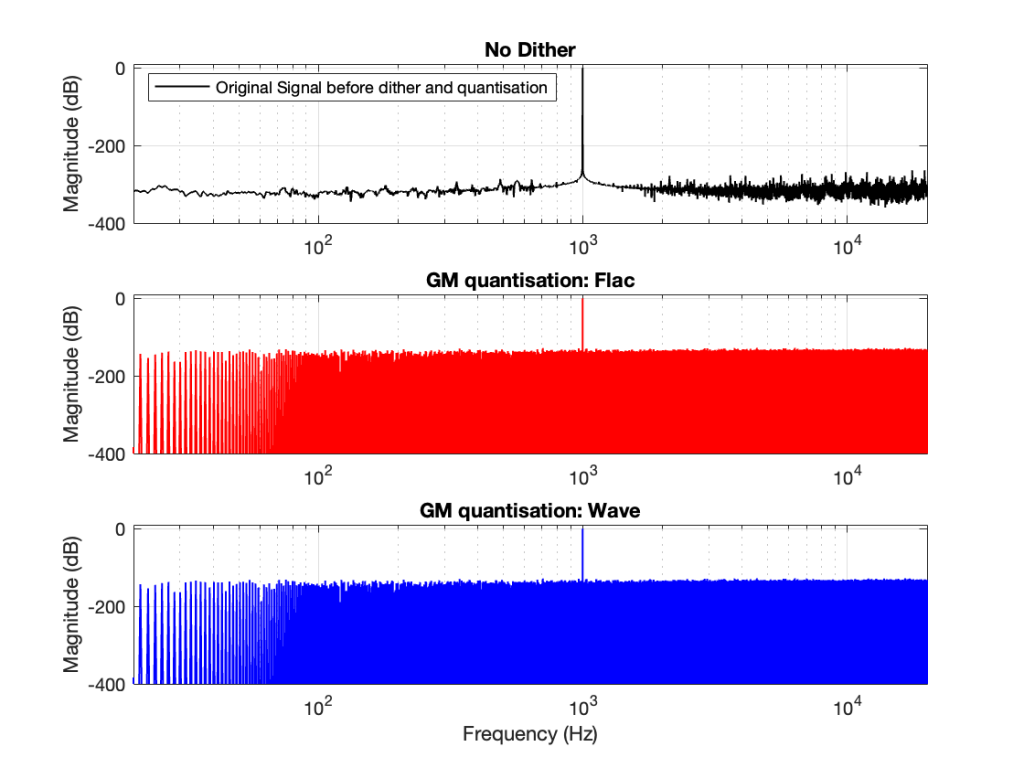
As you can see there, the imported .wav and .flac files behave identically. But, if you look carefully and compare to the .flac version in Figure 1, you’ll see that they’re different from THAT version.
The fact that the red and blue plots in Figure 3 are identical tell me that .wav and .flac are identical.
The fact that my quantisation results in identical results in .wav and .flac, but are different from Matlab’s “audiowrite” results (which produces .wav and .flac files that are different from each other) tells me that Matlab’s quantisation is different for .wav and .flac – and different from what I’m doing.
So, I go back to the ramp shown in Figure 2 and dig into the details again, zooming in on the samples near a value of -1, 0, and 1. These are shown below in Figure 4.
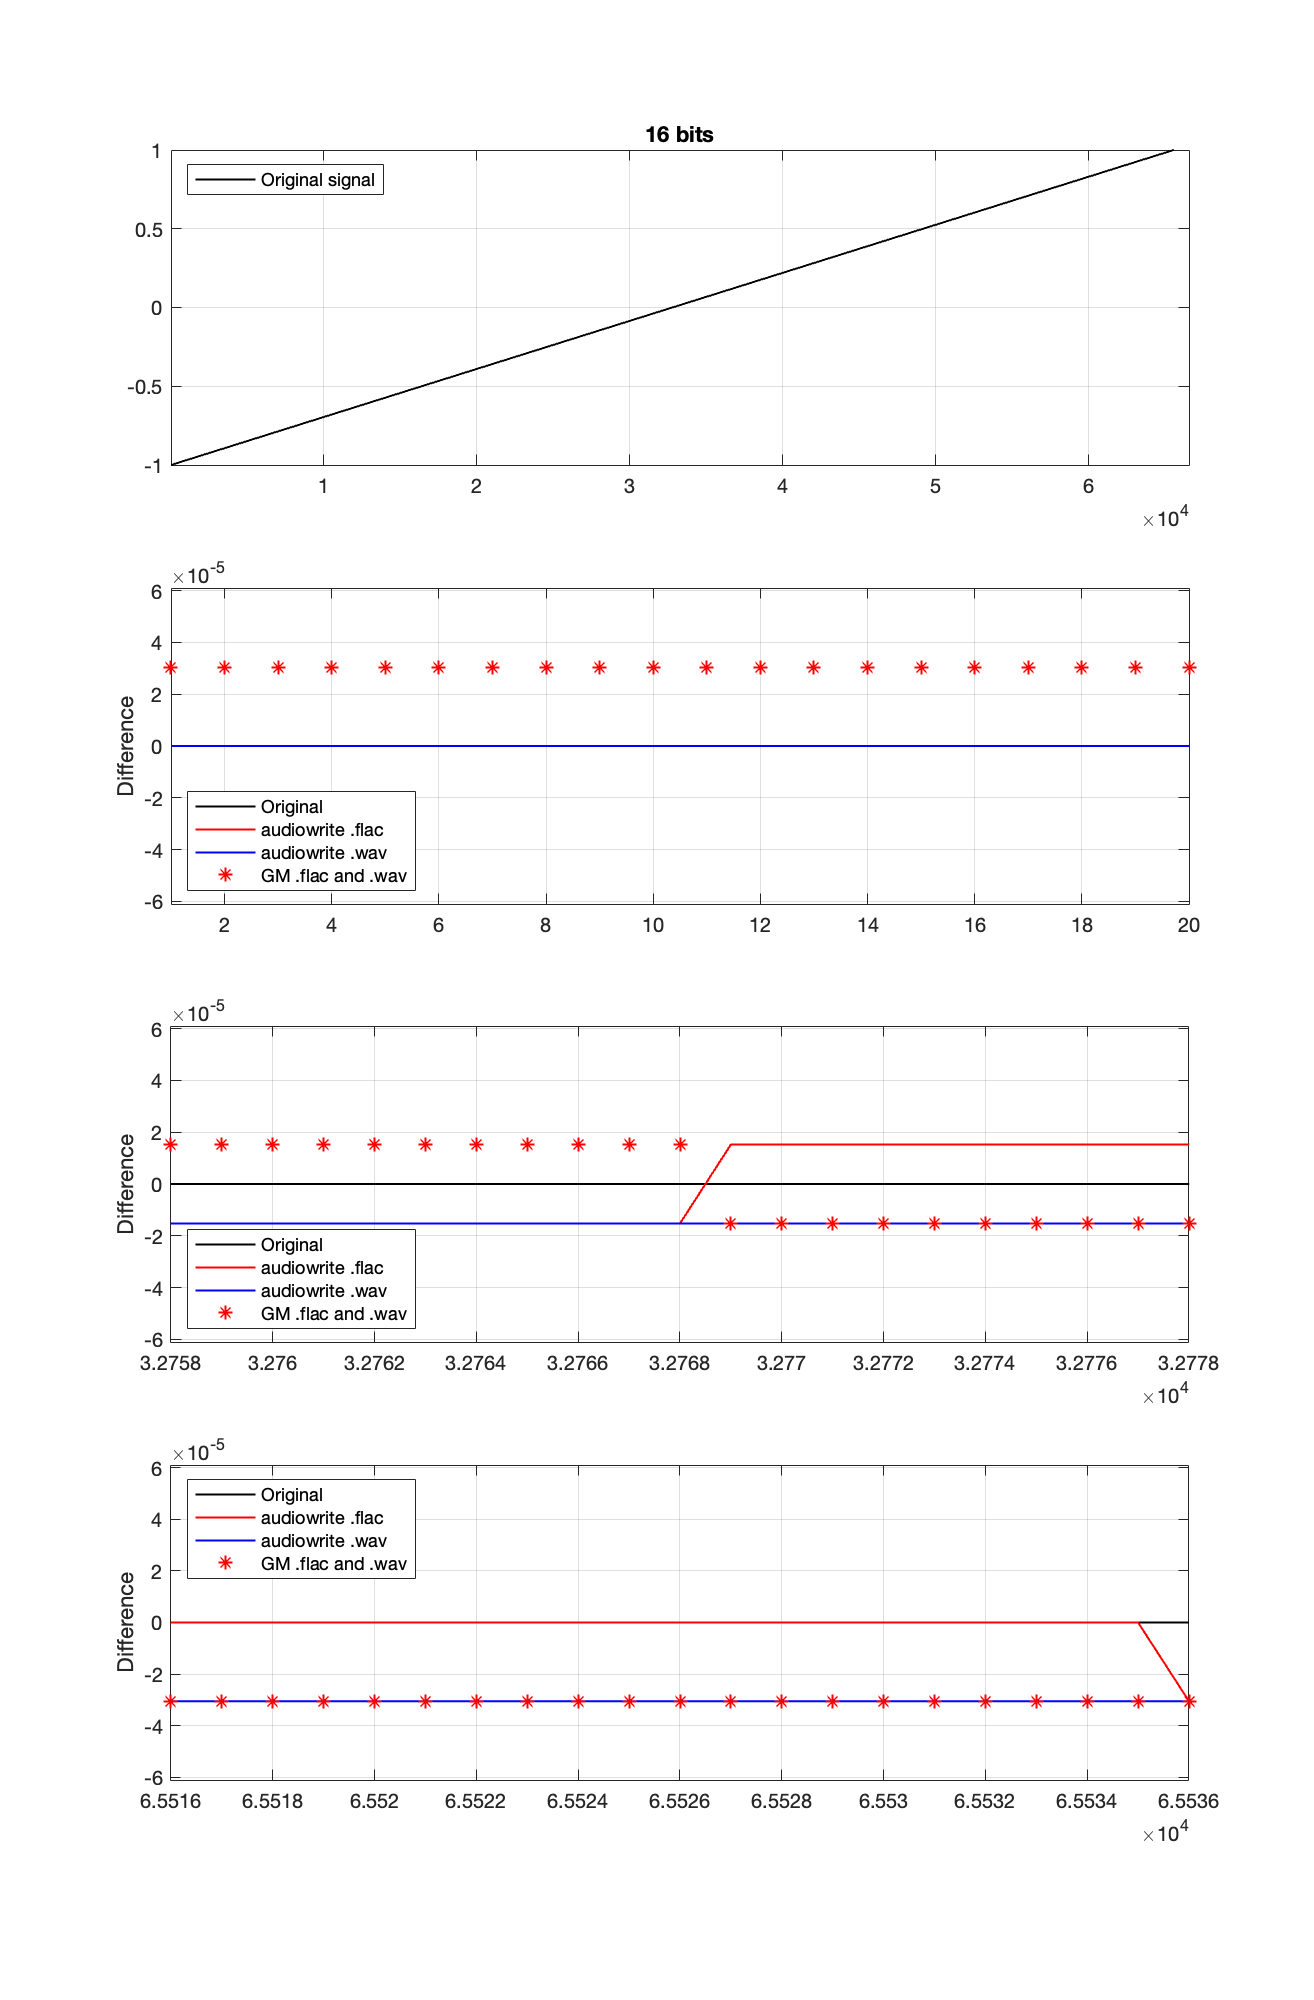
It’s a bit cryptic to see the results in Figure 4, but let’s walk through it.
- The top plot shows the ramp signal that I encoded as a 16-bit audio file in 4 different ways: as a .wav and a .flac, using audiowrite’s quantiser and mine.
- The second plot shows the differences in the imported files relative to the original for the first 20 samples, which correspond to the bottom 20 quantisation levels. As can be seen there, the audiowrite quantiser’s result appears to be identical to the original (they’re not, as we saw in the middle plot of Figure 1, but they’re close…). My quantiser is one level higher. This is because I’m scaling my original signal so that it can’t reach the bottom, as I talked about in Part 2.
- The third plot shows the behaviour of the three quantisers (2 audiowrites and mine) around the 0 value ±10 quantisation levels. Note that there’s no sample with a value of 0 (Because two’s complement is not symmetrical around the 0 value.). It’s not immediately obvious there, but all three quantisers have an “error” of 1/2 a quantisation level step around 0.
- Below 0, both of audiowrite’s quantisers have a negative offset, and mine has a positive offset.
- Above 0, audiowrite’s .flac quantiser has a positive offset whereas both audiowrite’s .wav quantiser and mine have a negative offset
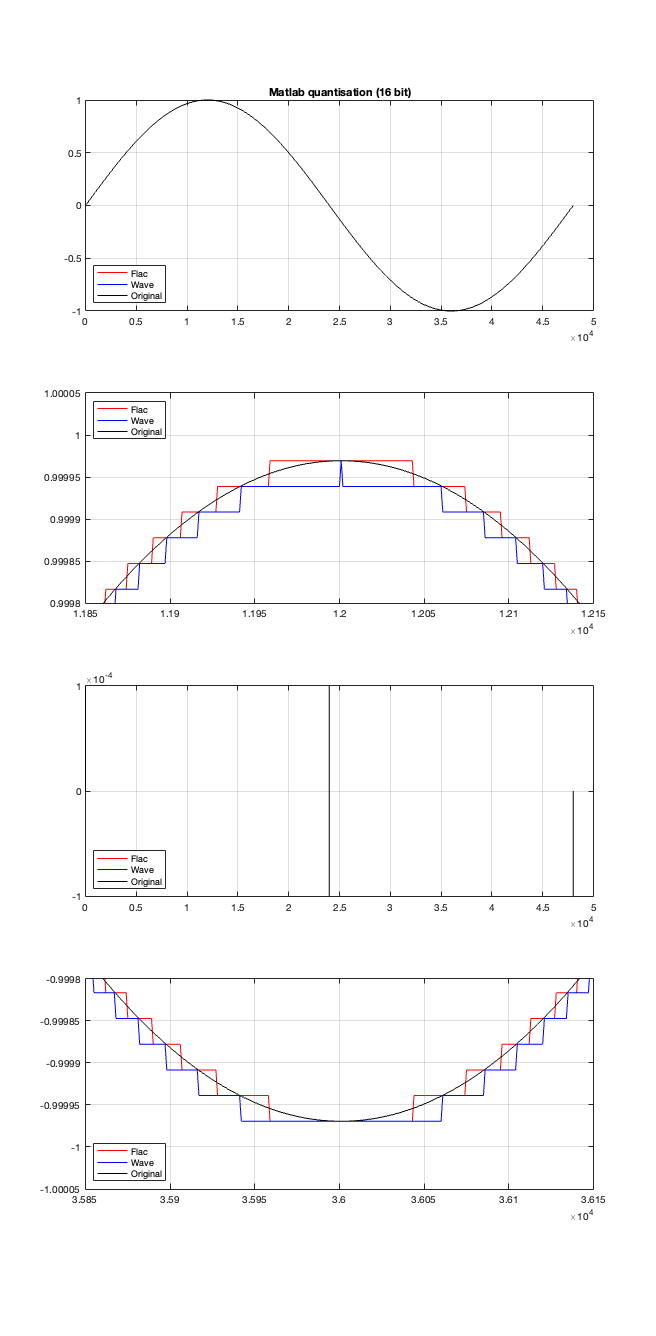
If the signal were a sine wave, then we’d see the same thing, it would just be harder to interpret, as shown in Figure 5. (There’s nothing useful shown in the third plot there because when you zoom in so closely , the slope of the sine wave as it passes 0 is really steep…)
I titled this series of posts “Excruciating minutiae” for a reason. The “error” (let’s call it a “difference” instead) is VERY small. It’s a difference of 1 quantisation level on a portion of the signal, which raises the very pragmatic question: “So what?”
Unless you’re REALLY digging into the bottom of the noise floor of a device, you probably never need to care about this. (In fact, even if you ARE digging into the bottom of the noise floor, you might not need to care.)
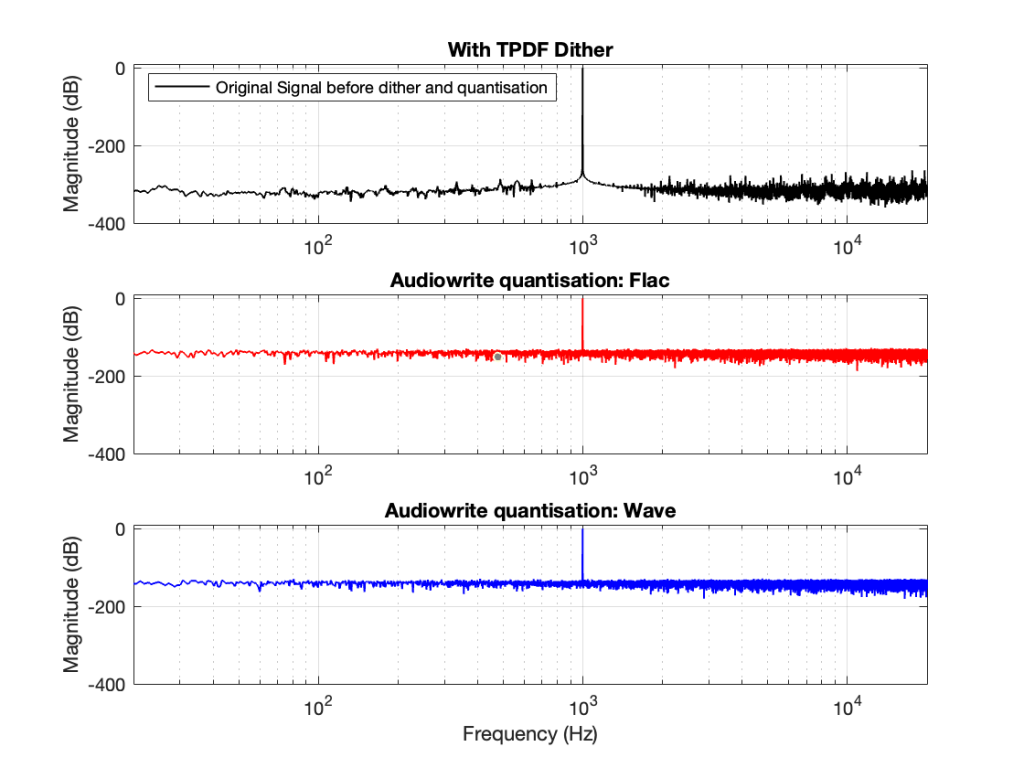
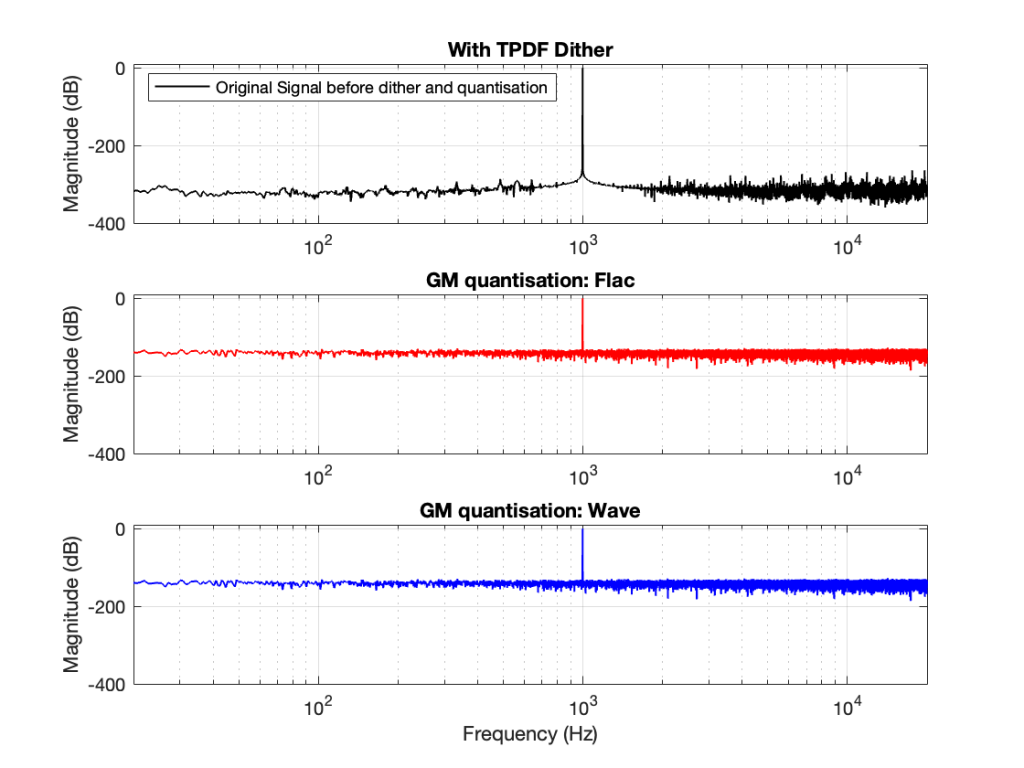
You CERTAINLY don’t have to worry about it if you’re just writing audio files to listen to, since you should be dithering those with TPDF dither, which will create a noise floor that is FAR above the “errors” caused by the differences I described above. This can be seen in Figures 6 and 7 below.
In other words, I’ve been using Matlab to export test files both in .wav and .flac for at least 20 years, and it’s only now that I’ve noticed this issue, which is another way of saying “don’t worry about it…”
Nota Bene
If you’re still awake, you might notice that there is one loose end… At the top of this posting I said
The less-important (but more interesting, later…) thing is that, for the FLAC import, every odd-numbered FFT bin is -∞ dB, which means that there is absolutely NO energy at those frequencies.
That will be the topic of another posting, since it’s more or less unrelated to this one – it was just an artefact of the test I described above.