Caveat: This is basically a geek version of a cover tune. The point that I make here was one that I originally heard someone else present at an AES convention years ago. However, since I haven’t heard anyone tell this story since, I’ve written it here.
Let’s build two black boxes, each of which creates a measurable distortion. We’ll call them Box “A” and Box “B”.
Box “A” has a measured THD+N of 20%. Box “B” has a measured THD+N of 2%. We’ll be using the old-fashioned way of measuring THD+N where we put a sine wave into the device, and apply a notch filter to the output at the same frequency of the sine wave and find the ratio of the level of the sine wave to the output of the notch filter.
Let’s put a 500 Hz sine wave into the boxes and listen to the output. The original sine wave sounds like the following:
The sine wave at the output of Box “A” (with a THD+N of 20%) sounds like the following:
The sine wave at the output of Box “B” (with a THD+N of 2%) sounds like the following:
So far so good. There should be no surprises yet.
Now let’s put a recording of something that I listen to all the time (my own voice) into the same black boxes to see what happens.
We’ll start with the original recording (this is just a file that I happened to have on my hard drive for testing imaging – ignore the fact that it talks about coming from the left channel only – your computer will probably play it as a mono file out both channels – this is irrelevant to the discussion):
Now let’s listen to how that recording sounds at the output of Box “A” (with a measured THD+N of 20%)
As you’ll hear, there is no audible distortion on the sound file, despite the fact that it has gone through a box that generates a distortion that we measured to be 20%.
Now let’s listen to how the original recording sounds at the output of Box “B” (with a measured THD+N of 2%)
As you will probably hear in that last sound file, the Box “B” – the one with “only” 2% distortion sounds MUCH worse than either the original sound file or the output of Box “A” which should have much more audible distortion.
So, the question is “why?”
Let’s look at the waveforms to see what’s going on here.
The original sine wave looks like the following:
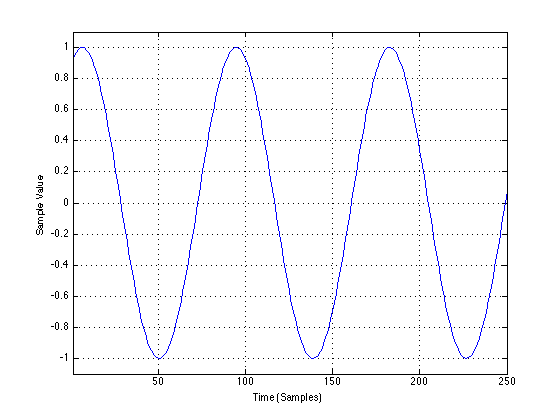
After that sine wave has gone through Box “A”, the output looks like the following:
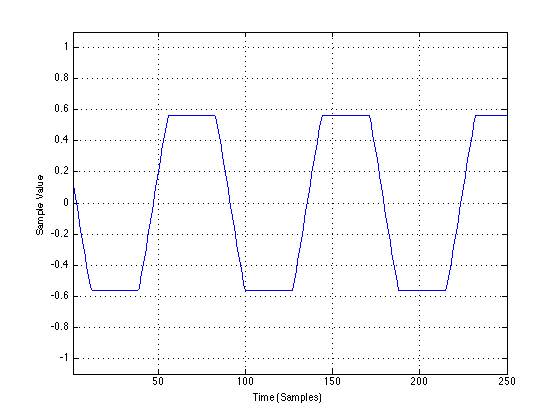
As you can see, I’ve created Box “A” to generate its distortion by clipping the signal at a limits of -0.5 and 0.5.
The output of Box “B” when fed with the same sine wave looks like the following:
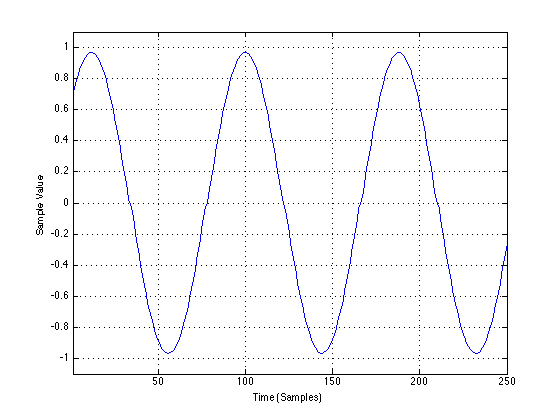
If we zoom in on that plot, it looks like the following:
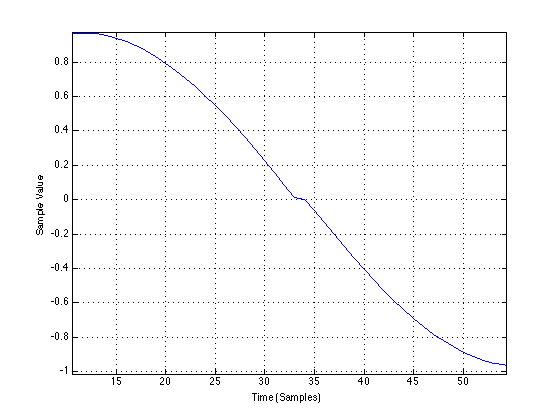
So, as you can see, I’ve made Box “B” to generate a zero-crossing distortion – but a pretty small one.
The reason the THD+N of Box “A” is 20% and that of Box “B” is only 2% is not just because the “damage” done to the signal is bigger with Box “A”. It’s also caused by where the damage is done. This might not make sense, so let’s look at the signals a little differently.
Let’s do a histogram of the original sine wave. This tells us how often the sample values are a given value. This is shown below in the following plot.
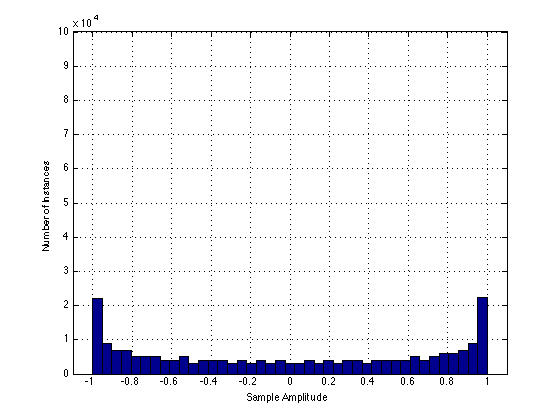
This histogram shows that the sample values in the original sine wave are usually near -1 and +1, and rarely around 0.
Now let’s look at a histogram of the output of Box “A” – the distorted sine wave with 20% THD+N. It looks like the following:
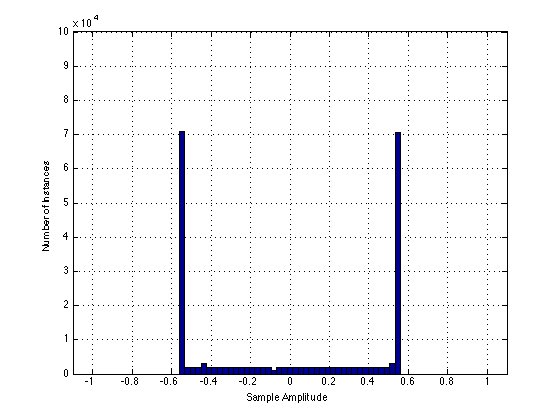
As can be seen in the plot above, the sample values from the original sine wave that were below -0.5 are now all congregated at -0.5, and the values that were above 0.5 are now congregated at 0.5. This is the result of the clipping applied to the signal.
By comparison, the histogram of the output of Box “B” is shown below:
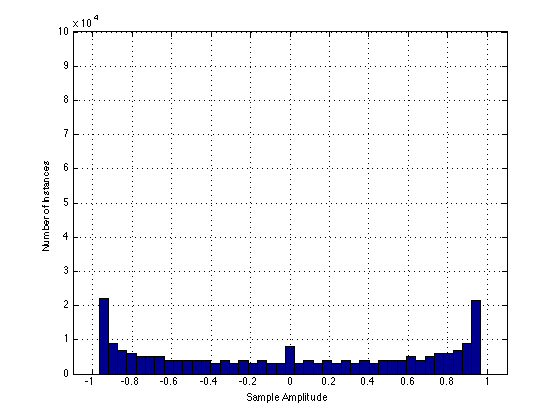
As you can see by comparing these last two plots, the zero crossing distortion of Box “B” results in a histogram that is more similar to the histogram of the original signal than that of the clipping distortion of Box “A”. This is because the zero crossing distortion distorts the signal where the signal rarely is.
Now let’s look at the histograms of the speech signal. Below is a histogram of the original speech recording.
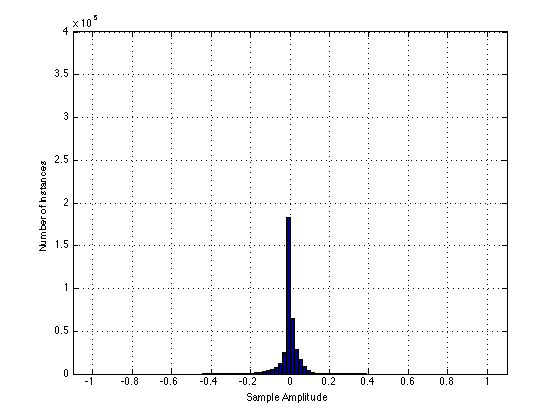
As you can see in this plot, the speech signal is unlike the sine wave in that it is usually at 0, and not at the extreme values of -1 and 1. In addition, you can see that very little, if any, of the signal is below -0.5 or above 0.5 which are the clipping values of Box “A”. Consequently, as you can see below, the histogram of the output of Box “A”, when fed with the speech signal, looks almost the same as the histogram of the original signal, above.
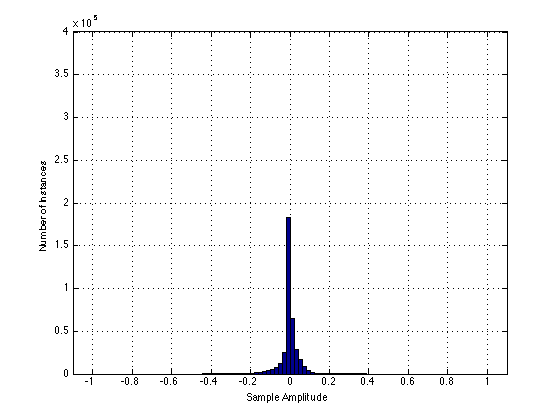
However, the output of Box “B” is different. The histogram of that signal is shown below:
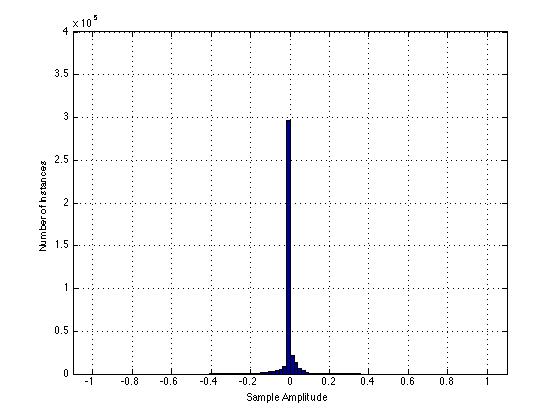
So, as you can see here: the zero crossing distortion is affecting the signal where it is most often, whereas the clipping of Box “A” has no effect on the signal.
The moral of the story
The point that I’ve (hopefully) illustrated here is that the value generated by a THD+N measurement is basically irrelevant when it comes to expressing how a device distorts a normal signal. However, the problem is not with the measurement technique, but the signal that is used in the procedure. We use a sine wave to do a THD+N measurement because that used to be the easy way to do a THD+N measurement back in the old days of signal generators, analogue notch filters, and voltmeters. The problem is that the probability distribution function (PDF) of that sine wave is completely unlike the PDF of a music or speech signal. So, if the distortion of the device affects the signals in the wrong place, then the result of the measurement will not reflect the sound of the device.